d3.js绘制单/多面板组合箱线图
用d3.js研发了个可以单面板、多面板展示的组合箱线图;
组合箱线图中包括普通散点、蜂群散点、小提琴图、小提琴箱线图、柱状图、误差棒、离群点等等,其中大部分你能想到的配置都是自行传参调整的,你想不到的也能稍作修改然后自行调整,上代码:
import * as d3 from "d3";
import { dispersedColorList } from "@/utils/commonData";
import { calc_bee_swarm_plot } from "@/utils/plot_helper";const CombinationBoxPlot = (options = {}) => {let data = options.data.plot_data;if (!data) return;let pValues = options.data.pValues;// 绘制显著性标记最大总和const metricSums = {};data.forEach((item) => {const metric = item.metric;const comparisonsLength = item.comparisons ? item.comparisons.length : 0;metricSums[metric] = (metricSums[metric] || 0) + comparisonsLength;});let maxSum = 0; //最大总和for (const metric in metricSums) {if (metricSums[metric] > maxSum) {maxSum = metricSums[metric];}}let chartHeight = options.params.isSmallTitle? 140 * (options.params.height / 100) + maxSum * 30: 400 * (options.params.height / 100) + maxSum * 30,chartWidth = options.params.isSmallTitle? 200 * (options.params.width / 100): 600 * (options.params.width / 100);// 获取标签样式function getSvgTextStyle({text = "",fontSize = 14,fontFamily = "Arial",fontWeight = "normal"} = {}) {const svg = d3.select("body").append("svg").attr("class", "get-svg-text-style");const textStyle = svg.append("text").text(text).attr("font-size", fontSize).attr("font-family", fontFamily).attr("font-weight", fontWeight).node().getBBox();svg.remove();return {width: textStyle.width,height: textStyle.height};}// 获取线性坐标轴宽高function getSvgBandAxisStyle({fontSize = 20,orient = "bottom",fontFamily = "Arial",fontWeight = "normal",rotate = 0,domain = ["A", "B", "C"],range = [0, 200]} = {}) {let axis;let svg = d3.select("body").append("svg").attr("width", 200).attr("height", 100).attr("transform", "translate(300, 200)").attr("class", "get-svg-axis-style");let scale = d3.scaleBand().domain(domain).range(range);if (orient === "bottom" || orient === "top") {axis = d3.axisBottom(scale);} else {axis = d3.axisLeft(scale);}let axisStyle = svg.append("g").call(axis).call((g) => {g.selectAll("text").attr("fill", "#555").attr("font-size", fontSize).attr("font-family", fontFamily).attr("font-weight", fontWeight).attr("tmpY",g.select("text").attr("tmpY") || g.select("text").attr("dy")).attr("dy",rotate > 70 && rotate <= 90? "0.35em": rotate >= -90 && rotate < -70? "0.4em": g.select("text").attr("tmpY")).attr("text-anchor",orient === "left"? "end": rotate? rotate > 0? "start": "end": "middle").attr("transform",`translate(0, 0) ${rotate ? `rotate(${rotate} 0 ${g.select("text").attr("y")})` : ""}`);}).node().getBBox();svg.remove();return {width: axisStyle.width,height: axisStyle.height};}// 动态计算星号function getStars(p) {if (p === 0) return "***";if (p < 0.001) return "***";else if (p < 0.01) return "**";else if (p < 0.05) return "*";else return "";}// 配置参数let {margin = { top: 30, right: 20, bottom: 40, left: 50 },panelsPerRow = 3, //每行放几个boxHeightRatio = 0.7,background = "#f0f0f0",panel_title = 12,plotAreaBg = "white",areaBgOpacity = 1,isBorder = true,isSmallTitle = true, //小标题和右边框 不给调boxPlotOpacity = 0.5,grid = false,meanValue = false,meanDot = 2,meanColor = "#ff0000",lineSpacing = 8, // 显著性标记线间距isdot = false, //散点dotType = "scatter",centrifugal = false,scatter = true,dotRadius = 1,beaswarm = true,beamDotRadius = 0.5,isError = true, //柱状图误差线showBoxPlots = true, // 显示箱线图borderSelect = "fill",boxPlotSingle = "#f0f0f0",borderWidth = 1,showViolins = true, // 显示小提琴图violinWidth = 0.9, //小提琴宽度 不给调violinOpacity = 0.5,violinStrokeWidth = 1,showBars = false, // 显示柱状图barWidthRatio = 1, // 柱状图宽度比例barOpacity = 0.7,errorType = "error",errorLineColor = "#333", // 误差线颜色errorLineWidth = 1, // 误差线宽度isLine = false,x_title = "",x_title_color = "#000",x_title_font = "Arial",x_title_size = 14,x_text_rotate = 90,x_text_color = "#000000",x_text_size = 12,x_text_font = "Arial",y_title = "",y_title_color = "#000",y_title_font = "Arial",y_title_size = 14,y_text_color = "#000000",y_text_size = 12,y_text_font = "Arial",main_title = "",main_title_color = "#000",main_title_font = "Arial",main_title_size = 14,panel_title_font = "Arial",panel_title_size = 10,panel_title_color = "#000000",legend_title = "",legend_title_color = "#000",legend_title_size = 14,legend_title_font = "Arial",legend_text_color = "#000000",legend_text_font = "Arial",legend_text_size = 12} = options.params;x_text_rotate = -x_text_rotate;let colors = dispersedColorList[options.params.color];if (options.params.type == "boxPlot") {showBoxPlots = true;showViolins = false;showBars = false;} else if (options.params.type == "violin") {showBoxPlots = true;showViolins = true;showBars = false;isdot = false;scatter = false;beaswarm = false;} else {showBoxPlots = false;showViolins = false;showBars = true;}if (options.params.isdot) {if (options.params.dotType == "scatter") {scatter = true;beaswarm = false;} else {scatter = false;beaswarm = true;}} else {scatter = false;beaswarm = false;}const box = document.querySelector(options.container);if (!box || !options.data.plot_data) return;// 计算布局参数const metrics = [...new Set(data.map((d) => d.metric))];// 处理数据分组const dataByMetric = d3.group(data, (d) => d.metric);// 计算XY轴的domainconst allGroups = [...new Set(metrics.flatMap((metric) => dataByMetric.get(metric).map((d) => d.group)))];const xDomain = allGroups;// const dataYDomain = options.data.yDomain;// let yDomain = {};// for (const key in dataYDomain) {//   const [min, max] = dataYDomain[key];//   yDomain[key] = [min - Math.abs(min * 0.3), max + Math.abs(max * 0.8)];// }const dataYDomain = options.data.yDomain;// 计算各指标原始数据范围const metricRanges = {};Object.entries(dataYDomain).forEach(([metric, [min, max]]) => {metricRanges[metric] = max - min;});// 计算全量指标的平均范围(用于归一化)const allRanges = Object.values(metricRanges);const avgRange = d3.mean(allRanges);// 动态计算每个指标的上界扩展系数const yDomain = {};Object.entries(dataYDomain).forEach(([metric, [min, max]]) => {// 当前指标的特性const range = metricRanges[metric];// 计算两个影响因子(均归一化到0-1区间)const rangeFactor = range / avgRange; // 范围因子(>1表示大范围)const comparisonFactor = Math.min(maxSum / 5, 1); // 比较次数因子(5次为基准)// 动态系数公式(可调参数)const baseCoefficient = 0.4; // 基础扩展比例const rangeWeight = 0.3; // 范围影响的权重const comparisonWeight = 0.3; // 比较次数影响的权重// 合成最终系数let dynamicCoefficient =baseCoefficient +rangeFactor * rangeWeight +comparisonFactor * comparisonWeight;// 限制系数范围(0.4-0.8)dynamicCoefficient = Math.min(Math.max(dynamicCoefficient, 0.3), 0.8);// 应用扩展计算yDomain[metric] = [min - Math.abs(min * 0.3),max + Math.abs(max * dynamicCoefficient)];});let mainTitleH = getSvgTextStyle({text: main_title,fontSize: main_title_size,fontFamily: main_title_font}).height;mainTitleH = main_title ? mainTitleH + 10 : 0;const xTitleH = getSvgTextStyle({text: x_title,fontSize: x_title_size,fontFamily: x_title_font}).height;const xAxisH = getSvgBandAxisStyle({fontSize: x_text_size,fontFamily: x_text_font,rotate: x_text_rotate,domain: xDomain}).height;//   const yTitleH = getSvgTextStyle({//     text: y_title,//     fontSize: y_title_size,//     fontFamily: y_title_font//   }).height;//   const yAxisW = getSvgBandAxisStyle({//     fontSize: y_text_size,//     fontFamily: y_text_font,//     domain: yDomain,//     orient: "left"//   }).width;const chartsPerRow = panelsPerRow? Math.min(panelsPerRow, metrics.length): Math.floor(window.innerWidth / chartWidth);// 图例字符串最长const maxLength = data.reduce((max, item) => Math.max(max, item.group.length),0);const legendWidth = 100 + maxLength * 15;const totalWidth = chartsPerRow * chartWidth + legendWidth;const rows = Math.ceil(metrics.length / chartsPerRow);const totalHeight = rows * (chartHeight + xAxisH) + mainTitleH;!d3.select(options.container).select("svg").empty() &&d3.select(options.container).select("svg").remove();const svg = d3.select(options.container).append("svg").attr("width", totalWidth).attr("height", totalHeight).attr("id", "combination-boxPlot");// 主标题svg.append("text").attr("class", "main-title").attr("x",isSmallTitle? (totalWidth - legendWidth) / 2: (totalWidth - legendWidth + margin.left) / 2).attr("y", mainTitleH) // 垂直居中.text(main_title).attr("text-anchor", "middle").attr("font-family", main_title_font).attr("font-size", main_title_size).attr("fill", main_title_color);const chartVerticalOffset = mainTitleH + 25;metrics.forEach((metric, index) => {const metricData = dataByMetric.get(metric);const row = Math.floor(index / chartsPerRow);const col = index % chartsPerRow;// 计算当前图表的偏移量const xOffset = col * chartWidth;const yOffset = row * (chartHeight + xAxisH) + chartVerticalOffset;// 创建图表容器const chart = svg.append("g").attr("transform", `translate(${xOffset},${yOffset})`);// 添加标题背景const titleWidth = isSmallTitle? chartWidth - margin.left - margin.right: 0;chart.append("rect").attr("class", "title-background").attr("x", margin.left).attr("y", 0).attr("width", titleWidth).attr("height", 30).style("fill", background).style("stroke", "#000").style("stroke-width", "1px").style("stroke-top", "1px").style("stroke-left", "1px").style("stroke-right", "1px");// 添加标题if (isSmallTitle) {chart.append("text").attr("class", "chart-title").attr("x", margin.left + titleWidth / 2).attr("y", 20).text(metric).attr("font-family", panel_title_font).attr("font-size", panel_title_size).attr("fill", panel_title_color).style("text-anchor", "middle");}// 箱线图区域高度const plotHeight = chartHeight * boxHeightRatio;if (!isSmallTitle) {margin.left = 100;// 添加右边框线chart.append("line").attr("x1", chartWidth - margin.right).attr("y1", margin.top).attr("x2", chartWidth - margin.right).attr("y2", margin.top + plotHeight).style("stroke", "#000").style("stroke-width", "1px");// 添加上边框线chart.append("line").attr("x1", margin.left).attr("y1", margin.top).attr("x2", chartWidth - margin.right).attr("y2", margin.top).style("stroke", "#000").style("stroke-width", "1px");// 添加X轴标题chart.append("text").attr("class", "x-axis-title").attr("x", margin.left + (chartWidth - margin.left - margin.right) / 2).attr("y", margin.top + plotHeight + margin.bottom + 15).text(x_title).attr("text-anchor", "middle").attr("font-family", x_title_font).attr("font-size", x_title_size).attr("fill", x_title_color);// 添加Y轴标题chart.append("text").attr("class", "y-axis-title").attr("x", -margin.top - plotHeight / 2).attr("y", margin.left / 2 - 15).text(y_title).attr("text-anchor", "middle").attr("transform", "rotate(-90)").attr("font-family", y_title_font).attr("font-size", y_title_size).attr("fill", y_title_color);}// 创建比例尺const xScale = d3.scaleBand().domain(xDomain).range([margin.left, chartWidth - margin.right]).padding(0.2);let metricYDomain = yDomain[metric];const yScale = d3.scaleLinear().domain(metricYDomain).range([plotHeight, 0]);// const yScale = d3.scaleLinear().domain(yDomain).range([plotHeight, 0]);// 绘制区域背景chart.append("rect").attr("x", margin.left).attr("y", margin.top).attr("width", titleWidth).attr("height", plotHeight).style("fill", plotAreaBg).style("opacity", areaBgOpacity);// 网格线if (grid) {chart.selectAll(".y-grid").data(yScale.ticks()).enter().append("line").attr("class", "y-grid").attr("x1", margin.left).attr("x2", chartWidth - margin.right).attr("y1", (d) => margin.top + yScale(d)).attr("y2", (d) => margin.top + yScale(d)).style("stroke", "rgba(0, 0, 0, 0.2)").style("stroke-opacity", 1).style("stroke-width", 0.5);chart.selectAll(".x-grid").data(xScale.domain()).enter().append("line").attr("class", "x-grid").attr("x1", (d) => xScale(d) + xScale.bandwidth() / 2).attr("x2", (d) => xScale(d) + xScale.bandwidth() / 2).attr("y1", margin.top).attr("y2", margin.top + plotHeight).style("stroke", "rgba(0, 0, 0, 0.2)").style("stroke-opacity", 1).style("stroke-width", 0.5);}// 添加绘图边框if (isBorder) {chart.append("rect").attr("x", margin.left).attr("y", margin.top).attr("width", titleWidth).attr("height", plotHeight).style("stroke", "#000").style("stroke-width", "1px").style("fill", "none");}// 添加p值let pValueText;if (pValues) {if (pValues[metric] !== false) {pValueText = chart.append("text").attr("class", "p-value").attr("x", (chartWidth + 30) / 2).attr("y", 50).text(`p = ${pValues[metric]}`).style("font-size", "8px").style("fill", "black").style("text-anchor", "middle");}}// 用于收集当前面板所有分组的散点const pointsByName = new Map();// 绘制箱线图if (showBoxPlots) {metricData.forEach((d, i) => {const [min, q1, median, q3, max] = d.boxplot;const center = xScale(d.group) + xScale.bandwidth() / 2;const color = colors[i % colors.length];const boxWidth = showViolins? xScale.bandwidth() * 0.3: xScale.bandwidth() * 0.8;const boxOffset = (xScale.bandwidth() - boxWidth) / 2;// 调用回调函数if (options.onBoxWidthCalculated) {options.onBoxWidthCalculated(boxWidth);}// 箱体chart.append("rect").attr("class", "box").attr("x", xScale(d.group) + boxOffset).attr("y", margin.top + yScale(q3)).attr("width", boxWidth).attr("height", yScale(q1) - yScale(q3)).attr("stroke-width", borderWidth).attr("stroke", borderSelect == "fill" ? color : boxPlotSingle).attr("fill", color).attr("fill-opacity", boxPlotOpacity);chart.append("line").attr("class", "median-line").attr("x1", xScale(d.group) + boxOffset).attr("x2", xScale(d.group) + boxOffset + boxWidth).attr("y1", margin.top + yScale(median)).attr("y2", margin.top + yScale(median)).style("stroke", borderSelect == "fill" ? color : boxPlotSingle).style("opacity", 1).style("stroke-width", "1px");const upperWhiskerLimit = q3 + 1.5 * (q3 - q1);const lowerWhiskerLimit = q1 - 1.5 * (q3 - q1);const upperWhisker = Math.min(max, upperWhiskerLimit);chart.append("line").attr("class", "whisker").attr("x1", center).attr("x2", center).attr("y1", margin.top + yScale(upperWhisker)).attr("y2", margin.top + yScale(q3)).style("stroke", borderSelect == "fill" ? color : boxPlotSingle).style("stroke-width", "1px");const lowerWhisker = Math.max(min, lowerWhiskerLimit);chart.append("line").attr("class", "whisker").attr("x1", center).attr("x2", center).attr("y1", margin.top + yScale(lowerWhisker)).attr("y2", margin.top + yScale(q1)).style("stroke", borderSelect == "fill" ? color : boxPlotSingle).style("stroke-width", "1px");// 绘制显著性标记if (d.comparisons) {// // 找出当前面板中最高的箱子的顶部位置// let maxBoxTop = 0;// metricData.forEach((d) => {//   const boxTop = yScale(d.boxplot[4]); // boxplot[4]是最大值//   if (boxTop < maxBoxTop || maxBoxTop === 0) {//     maxBoxTop = boxTop;//   }// });// // 计算标记的基础Y位置(最高箱子上方30px)// const baseY = margin.top + maxBoxTop - 30;// let lineLevel = 0;const pValueBBox = pValueText.node().getBBox();// 计算基准位置let baseY = 0;if (maxSum > 10) {baseY = pValueBBox.y - 10 + pValueBBox.height * maxSum;} else {baseY = pValueBBox.y + 7 + pValueBBox.height * maxSum;}console.log(baseY);let lineLevel = 0;d.comparisons.forEach((comp) => {const currentGroupCenter = xScale(d.group) + xScale.bandwidth() / 2;const compareGroupCenter = xScale(comp.vs) + xScale.bandwidth() / 2;const stars = getStars(comp.p);if (stars) {// 自动寻找可用层级(冲突检测)let foundLevel = false;while (!foundLevel) {// 检查当前层级是否被占用const existingLines = chart.selectAll(`.level-${lineLevel}`);if (existingLines.empty()) {foundLevel = true;} else {lineLevel++;}}// 计算当前层级的Y坐标,确保不超出面板顶部const currentY = Math.max(margin.top + 10,baseY - lineLevel * lineSpacing);// 绘制连接线chart.append("line").attr("class", `significance-line level-${lineLevel}`).attr("x1", currentGroupCenter).attr("x2", compareGroupCenter).attr("y1", currentY).attr("y2", currentY).style("stroke", "#ff4444").style("stroke-width", 1).style("marker-end", "url(#arrowhead)");// 添加星号chart.append("text").attr("class", "significance-star").attr("x", (currentGroupCenter + compareGroupCenter) / 2).attr("y", currentY + 1.5).text(stars).style("font-size", "10px").style("fill", "#cc0000").style("font-weight", "bold");lineLevel++;}});}// 散点图if (scatter && d.scatter) {const center = xScale(d.group) + xScale.bandwidth() / 2;const bandwidth = xScale.bandwidth();d.scatter.forEach((point) => {// const xPos = center + point.x * (bandwidth / 2); // 计算x坐标const xPos = center + (Math.random() * 1.6 - 0.8) * (bandwidth / 2); // 计算x坐标const yPos = margin.top + yScale(point.y); // 计算y坐标const name = point.name;const group = d.group;if (!pointsByName.has(name)) {pointsByName.set(name, []);}pointsByName.get(name).push({ x: xPos, y: yPos, group });// 绘制散点chart.append("circle").attr("cx", xPos).attr("cy", yPos).attr("r", dotRadius).attr("fill", colors[i % colors.length]); // 使用分组颜色});}// 离群点if (centrifugal && d.scatter) {d.scatter.forEach((point) => {if (lowerWhisker > point.y || upperWhisker < point.y) {// 计算坐标const center = xScale(d.group) + xScale.bandwidth() / 2;const yPos = margin.top + yScale(point.y);chart.append("circle").attr("cx", center).attr("cy", yPos).attr("r", 2).attr("fill", "none").attr("stroke", colors[i % colors.length]).attr("stroke-width", 0.5);}});}// 绘制同名点连接线if (isLine) {pointsByName.forEach((points, name) => {const groups = new Set(points.map((p) => p.group));if (groups.size < 2) return;// 为每个点与其他组的点连线points.forEach((p1, i) => {points.slice(i + 1).forEach((p2) => {if (p1.group !== p2.group) {chart.append("line").attr("class", "scatter-line").attr("x1", p1.x).attr("y1", p1.y).attr("x2", p2.x).attr("y2", p2.y).attr("stroke", "#666").attr("stroke-width", 0.8).attr("opacity", 0.6);}});});});}// 绘制均值点if (meanValue) {const meanValue = d.boxplot[d.boxplot.length - 1]; // 获取最后一个值chart.append("circle").attr("class", "mean-point").attr("cx", center).attr("cy", margin.top + yScale(meanValue)).attr("r", meanDot).attr("fill", meanColor).attr("stroke-width", 1);// .append("title") // 添加tooltip// .text(`Mean: ${meanValue.toFixed(2)}`);}// 蜂群图if (beaswarm && d.scatter) {const center = xScale(d.group) + xScale.bandwidth() / 2;const bandwidth = xScale.bandwidth();// 根据显示类型确定箱体半宽const boxHalfWidth = showViolins? (bandwidth * 0.3) / 2: (bandwidth * 0.8) / 2;const r = beamDotRadius;const beeSwarm = calc_bee_swarm_plot(d.scatter, yScale, r);// console.log(beeSwarm);beeSwarm.forEach((point) => {// 限制x偏移在箱体宽度范围内const clampedX = Math.max(-boxHalfWidth,Math.min(point.x, boxHalfWidth));// const xPos = center + point.x; // 计算x坐标const xPos = center + clampedX; // 计算x坐标const yPos = margin.top + point.y; // 计算y坐标chart.selectAll(".beeswarm-point").data(d.scatter).enter().append("circle").attr("class", "beeswarm").attr("cx", () => {return xPos;}).attr("cy", () => {return yPos;}).attr("r", r).attr("fill", "none").attr("stroke", colors[i % colors.length]);});}});}// 小提琴if (showViolins) {scatter = false;beaswarm = false;metricData.forEach((d, i) => {if (!d.violin) return;const violin = d.violin;const color = colors[i % colors.length];const center = xScale(d.group) + xScale.bandwidth() / 2;const bandwidth = xScale.bandwidth();const violinScale = d3.scaleLinear().domain([0, d3.max(violin.density)]).range([0, (bandwidth * violinWidth) / 2]);const areaGenerator = d3.area().x0((d) => center - violinScale(d)).x1((d) => center + violinScale(d)).y((d, i) => margin.top + yScale(violin.Y[i])).curve(d3.curveCatmullRom);chart.append("path").datum(violin.density).attr("class", "violin").attr("d", areaGenerator).attr("fill", color).attr("fill-opacity", violinOpacity);//   .attr("stroke", color)//   .attr("stroke-width", violinStrokeWidth);});}// 柱状图if (showBars) {metricData.forEach((d, i) => {if (!d.bar) return;const color = colors[i % colors.length];const center = xScale(d.group) + xScale.bandwidth() / 2;const barWidth = xScale.bandwidth() * barWidthRatio;// 绘制柱状图chart.append("rect").attr("class", "bar").attr("x", center - barWidth / 2).attr("y", margin.top + yScale(d.bar.value)).attr("width", barWidth).attr("height", plotHeight - yScale(d.bar.value)).attr("fill", color).attr("opacity", barOpacity);// 绘制误差线if (isError && d.bar.error) {const currentYDomain = yDomain[metric];let errorTop = 0;let errorBottom = 0;if (errorType === "error") {errorTop = Math.min(d.bar.value + d.bar.error, currentYDomain[1]);errorBottom = Math.max(d.bar.value - d.bar.error,currentYDomain[0]);} else {errorTop = Math.min(d.bar.value + d.bar.deviation,currentYDomain[1]);errorBottom = Math.max(d.bar.value - d.bar.deviation,currentYDomain[0]);}// 主误差线chart.append("line").attr("class", "error-line").attr("x1", center).attr("x2", center).attr("y1", margin.top + yScale(errorTop)).attr("y2", margin.top + yScale(errorBottom)).attr("stroke", errorLineColor).attr("stroke-width", errorLineWidth);// 误差线顶部横杠chart.append("line").attr("class", "error-cap").attr("x1", center - barWidth / 5).attr("x2", center + barWidth / 5).attr("y1", margin.top + yScale(errorTop)).attr("y2", margin.top + yScale(errorTop)).attr("stroke", errorLineColor).attr("stroke-width", errorLineWidth);// 误差线底部横杠chart.append("line").attr("class", "error-cap").attr("x1", center - barWidth / 5).attr("x2", center + barWidth / 5).attr("y1", margin.top + yScale(errorBottom)).attr("y2", margin.top + yScale(errorBottom)).attr("stroke", errorLineColor).attr("stroke-width", errorLineWidth);}// 散点图if (scatter && d.scatter) {const center = xScale(d.group) + xScale.bandwidth() / 2;const bandwidth = xScale.bandwidth();d.scatter.forEach((point) => {// const xPos = center + point.x * (bandwidth / 2); // 计算x坐标const xPos = center + (Math.random() * 1.6 - 0.8) * (bandwidth / 2); // 计算x坐标const yPos = margin.top + yScale(point.y); // 计算y坐标chart.append("circle").attr("cx", xPos).attr("cy", yPos).attr("r", dotRadius).attr("fill", colors[i % colors.length]); // 使用分组颜色});}// 蜂群图if (beaswarm && d.scatter) {const center = xScale(d.group) + xScale.bandwidth() / 2;const bandwidth = xScale.bandwidth();// 根据显示类型确定箱体半宽const boxHalfWidth = showViolins? (bandwidth * 0.3) / 2: (bandwidth * 0.8) / 2;const r = beamDotRadius;const beeSwarm = calc_bee_swarm_plot(d.scatter, yScale, r);// console.log(beeSwarm);beeSwarm.forEach((point) => {// 限制x偏移在箱体宽度范围内const clampedX = Math.max(-boxHalfWidth,Math.min(point.x, boxHalfWidth));// const xPos = center + point.x; // 计算x坐标const xPos = center + clampedX; // 计算x坐标const yPos = margin.top + point.y; // 计算y坐标chart.selectAll(".beeswarm-point").data(d.scatter).enter().append("circle").attr("class", "beeswarm").attr("cx", () => {return xPos;}).attr("cy", () => {return yPos;}).attr("r", r).attr("fill", "none").attr("stroke", colors[i % colors.length]);});}// 绘制显著性标记if (d.comparisons) {const pValueBBox = pValueText.node().getBBox();// 计算基准位置let baseY = 0;if (maxSum > 10) {baseY = pValueBBox.y - 10 + pValueBBox.height * maxSum;} else {baseY = pValueBBox.y + 7 + pValueBBox.height * maxSum;}console.log(baseY);let lineLevel = 0;d.comparisons.forEach((comp) => {const currentGroupCenter = xScale(d.group) + xScale.bandwidth() / 2;const compareGroupCenter = xScale(comp.vs) + xScale.bandwidth() / 2;const stars = getStars(comp.p);if (stars) {// 自动寻找可用层级(冲突检测)let foundLevel = false;while (!foundLevel) {// 检查当前层级是否被占用const existingLines = chart.selectAll(`.level-${lineLevel}`);if (existingLines.empty()) {foundLevel = true;} else {lineLevel++;}}// 计算当前层级的Y坐标,确保不超出面板顶部const currentY = Math.max(margin.top + 10,baseY - lineLevel * lineSpacing);// 绘制连接线chart.append("line").attr("class", `significance-line level-${lineLevel}`).attr("x1", currentGroupCenter).attr("x2", compareGroupCenter).attr("y1", currentY).attr("y2", currentY).style("stroke", "#ff4444").style("stroke-width", 1).style("marker-end", "url(#arrowhead)");// 添加星号chart.append("text").attr("class", "significance-star").attr("x", (currentGroupCenter + compareGroupCenter) / 2).attr("y", currentY + 1.5).text(stars).style("font-size", "10px").style("fill", "#cc0000").style("font-weight", "bold");lineLevel++;}});}});}// 添加X轴const xAxis = d3.axisBottom(xScale);chart.append("g").attr("class", "x-axis").attr("transform", `translate(0,${margin.top + plotHeight})`).call(xAxis).call((g) => {g.selectAll(".tick text").attr("fill", x_text_color).attr("font-size", x_text_size).attr("font-family", x_text_font).each(function () {const text = d3.select(this);text.attr("tmpY", text.attr("dy") || 0);}).attr("dy", (d, i, nodes) => {const text = d3.select(nodes[i]);const rotate = x_text_rotate;// 动态计算垂直偏移if (rotate > 70 && rotate <= 90) return "0.35em";if (rotate >= -90 && rotate < -70) return "0.4em";return text.attr("tmpY");}).attr("text-anchor", (d) =>x_text_rotate ? (x_text_rotate > 0 ? "start" : "end") : "middle").attr("transform", (d, i, nodes) =>x_text_rotate? `rotate(${x_text_rotate} 0 ${d3.select(nodes[i]).attr("y")})`: "");});// 添加Y轴const yAxis = d3.axisLeft(yScale);chart.append("g").attr("class", "y-axis").attr("transform", `translate(${margin.left},${margin.top})`).call(yAxis).selectAll(".tick text").attr("fill", y_text_color).attr("font-size", y_text_size).attr("font-family", y_text_font);});// 添加图例const legend = svg.append("g").attr("class", "legend").attr("transform",`translate(${chartsPerRow * chartWidth + 20}, ${30 + chartVerticalOffset})`);// 添加图例标题legend.append("text").attr("class", "legend-title").attr("x", 0).attr("y", -15).text(legend_title).attr("font-family", legend_title_font).attr("fill", legend_title_color).attr("font-size", legend_title_size);// 获取图例分组和颜色映射const groups = [...new Set(data.map((d) => d.group))].sort();// 绘制图例项groups.forEach((group, i) => {const legendItem = legend.append("g").attr("transform", `translate(0, ${i * 15})`);// 颜色方块legendItem.append("rect").attr("width", 10).attr("height", 10).attr("fill", colors[i % colors.length]);// 文字标签legendItem.append("text").attr("class", "legend-item").attr("x", 15).attr("y", 9).text(group).attr("font-family", legend_text_font).attr("fill", legend_text_color).attr("font-size", legend_text_size);});
};export default CombinationBoxPlot;
完美~
然后页面调用方法:
CombinationBoxPlot({data: plots,params: chartParam,container: "#combination-boxPlot",onBoxWidthCalculated: (width) => {boxWidths = width;}});展示部分效果图吧:
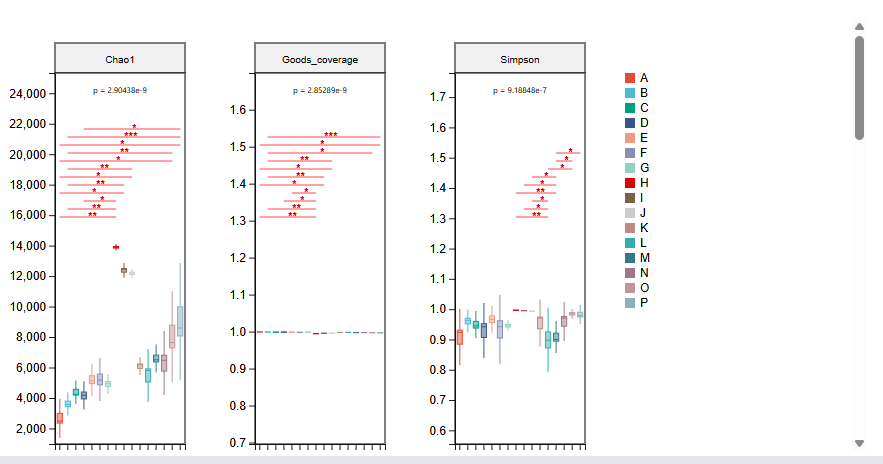
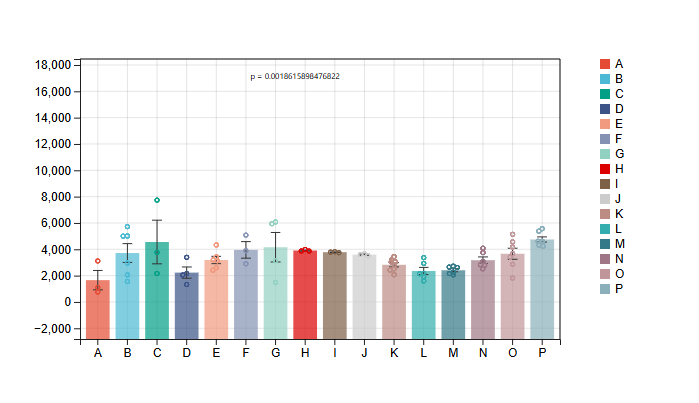
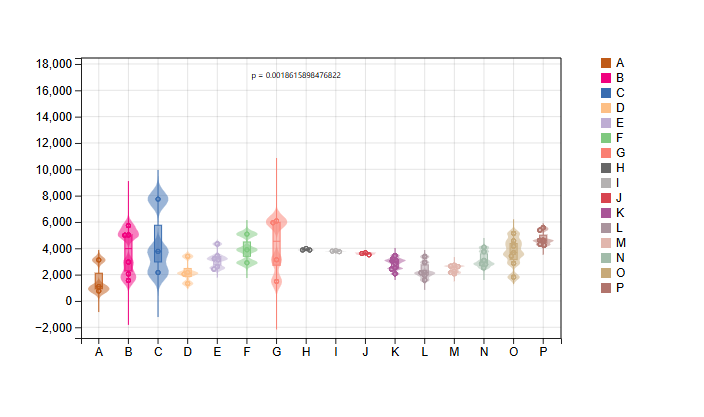
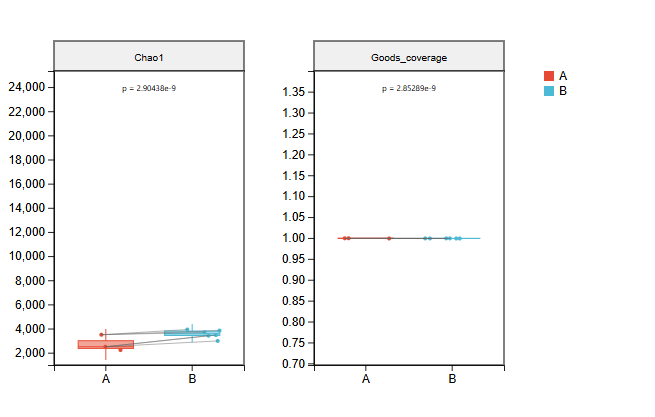
我真的是太太太太太太太太太太太太棒啦 
相关文章:

d3.js绘制单/多面板组合箱线图
用d3.js研发了个可以单面板、多面板展示的组合箱线图; 组合箱线图中包括普通散点、蜂群散点、小提琴图、小提琴箱线图、柱状图、误差棒、离群点等等,其中大部分你能想到的配置都是自行传参调整的,你想不到的也能稍作修改然后自行调整&#x…...

第二十四天 - 分布式任务队列 - Celery高级应用 - 练习:分布式监控任务系统
一、Celery核心机制解析 1.1 分布式架构四要素 # celery_config.py BROKER_URL redis://:passwordlocalhost:6379/0 # 消息中间件 RESULT_BACKEND redis://:passwordlocalhost:6379/1 # 结果存储 TASK_SERIALIZER json ACCEPT_CONTENT [json] TIMEZONE Asia/Shanghai核…...

IDEA使用jclasslib Bytecode Viewer查看jvm字节码
学习jvm的时候,想查看字节码和局部变量表,可以使用idea安装jclasslib Bytecode View插件查看。 (1)安装工具: 安装完成后需要重启idea. (2)准备一段代码,编译运行 package com.te…...

list.
列表类型是用来存储多个有序的字符串,列表中的每个字符串称为元素(element),⼀个列表最多可以存储个元素 在 Redis 中,可以对列表两端插入(push)和弹出(pop),…...

202520读书笔记|《我要按自己喜欢的方式去生活》——面对可能到来的裁员,那就等正式通知吧
《我要按自己喜欢的方式去生活》作者宝夏夏,很赞的一本书,通透真实,不矫揉造作,直击内心。 因为第一个故事,裁员而进来的。早晨睡眼惺忪醒来,闺蜜半夜发来一大段话,大意是公司在缩减成本裁员&am…...

Linux 文件传输:系统数据交互的动脉
前言:sshd 在Linux系统中,文件传输常依赖于SSH协议(Secure Shell),而sshd(OpenSSH Daemon)是负责处理SSH连接的后台服务程序。通过sshd,用户可以在加密的通道中进行安全的远程登录、…...

Rust + WebAssembly 生产部署指南
1 最小可行部署(MVP) 前端打包wasm-pack build --target web --release # 生成 .wasm JS 包装器 npm run build / vite build / webpack … # 打包 HTML/CSS/JS 资源拷贝产物 到生产服务器的站点目录dist/ ├── index.html ├── pkg…...

git忽略已跟踪的文件/指定文件
在项目开发中,有时候我们并不需要git跟踪所有文件,而是需要忽略掉某些指定的文件或文件夹,怎么操作呢?我们分两种情况讨论: 1. 要忽略的文件之前并未被git跟踪 这种情况常用的方法是在项目的根目录下创建和编辑.gitig…...

基于Django实现的图书分析大屏系统项目
图书分析大屏展示系统项目大纲与启动教程 一、项目概述 图书分析大屏展示系统是一个基于Django框架开发的Web应用,主要用于图书数据的可视化分析与展示。该系统采用MVT(Model-View-Template)架构模式,结合MySQL数据库࿰…...

【OSCP-vulnhub】GoldenEye
目录 端口扫描 查找源代码 目录扫描 POP3邮件枚举 1.先枚举用户名 2.hydra爆破 3.nc连接 boris: natalya: 设置本地hosts文件 doak: 解析图片 exiftool for-007.jpg strings for-007.jpg 使用MSF去搜索内核版本 漏洞利用 ---…...

OpenAI发布GPT-4.1系列模型,主打编程能力提升
OpenAI在本周一推出了全新一代模型家族——GPT-4.1系列。没错,就是“4.1”,尽管OpenAI的命名方式已经让人有些摸不着头脑。 这一系列包括三个型号:GPT-4.1、GPT-4.1 mini和GPT-4.1 nano。据OpenAI介绍,这些模型在编程任务和指令遵…...
)
压缩包网页预览(zip-html-preview)
zip-html-preview 项目介绍 这是一个基于 Spring Boot 开发的在线 ZIP 文件预览工具,主要用于预览 ZIP 压缩包中的 HTML 文件及其相关资源。 主要功能 支持拖拽上传或点击选择多个 ZIP 文件自动解压并提取 ZIP 文件中的 HTML 文件在线预览 HTML 文件及其相关的 CSS、JavaSc…...
颜色空间转换----- BGR 图像转换为灰度图像函数BGR2Gray())
OpenCV 图形API(41)颜色空间转换----- BGR 图像转换为灰度图像函数BGR2Gray()
操作系统:ubuntu22.04 OpenCV版本:OpenCV4.9 IDE:Visual Studio Code 编程语言:C11 算法描述 将图像从BGR色彩空间转换为灰度。 B、G和R通道值的传统范围是0到255。结果的灰度颜色值计算为: dst ( I ) 0.114 ∗ src ( I ) . B…...

影视产业链中的律师角色以及合规风控要点
影视产业链中的律师角色以及合规风控要点 在影视娱乐业务中,律师服务贯穿项目全生命周期,涵盖创意开发、投z制作、发行传播、艺人管理及争议等多个领域 一、影视项目全流程合同法律事务 ✔️项目开发阶段 剧本合作:剧本委托创作、改编、版权…...

Java工具类——实体类列表写入excel
Java工具类——实体类列表写入excel /*** 将实体类 List 数据写入 Excel 文件* param dataList 实体类对象列表* param filePath Excel 文件路径* param sheetName Sheet 名称* param <T> 泛型类型* throws IOException 文件操作异常* throws IllegalAccessException 反…...

C++23 新预处理器指令详解:#elifdef、#elifndef 和 #warning
文章目录 1. #elifdef 和 #elifndef:更灵活的条件编译1.1 背景与动机1.2 语法与示例示例代码: 1.3 编译器支持 2. #warning:发出编译警告2.1 背景与动机2.2 语法与示例示例代码: 2.3 编译器支持 3. 总结 C23 标准引入了多项改进&a…...

书写API文档的最佳实践[特殊字符]
API文档对于API的可用性和成功至关重要。完善的API文档能显著提高开发者体验,加速采用,并培养强大的开发者社区。反之,糟糕的文档可能导致困惑、挫败感和错误,从而降低采用率。本文将探讨编写清晰、全面、开发者友好的API文档的高…...

【Maven】手动安装依赖到本地仓库
【Maven】手动安装依赖到本地仓库 【一】下载依赖【二】安装 JAR 文件到本地仓库【三】验证安装【四】在项目中使用该依赖【1】注意事项【2】额外提示 【一】下载依赖 登录到中央仓库下载依赖,中央仓库地址:https://mvnrepository.com/ 搜搜你的依赖的a…...

kali下maven 的安装与配置
1、下载 maven 安装包 wget https://dlcdn.apache.org/maven/maven-3/3.9.4/binaries/apache-maven-3.9.4-bin.tar.gz 2、解压 apache-maven-3.9.4-bin.tar.gz tar -zxvf apache-maven-3.9.4-bin.tar.gz 找到文件解压到的位置,由于解压时我们没有指定路径&#x…...

list的模拟实现和反向迭代器的底层
1:list的模拟实现 1:链表的节点 对于list的模拟实现,我们需要先定义一个节点的类可以使用(class也可以使用struct) // List的节点类 template<class T> struct ListNode {ListNode(const T& val T()){_p…...
(七))
OpenHarmony - 小型系统内核(LiteOS-A)(七)
OpenHarmony - 小型系统内核(LiteOS-A)(七) 八、文件系统 适配新的文件系统 基本概念 所谓对接VFS层,其实就是指实现VFS层定义的若干接口函数,可根据文件系统的特点和需要适配其中部分接口。一般情况下&…...

四层板的时钟线设计:关键要点与实用策略
在电子电路设计领域,四层板凭借其出色的电气性能和合理的空间布局,广泛应用于各类电子产品中。而时钟线作为系统的 “心跳”,为整个电路提供同步信号,其设计质量直接关系到系统的稳定性、可靠性和性能表现。因此,深入探…...

【TypeScript类型系统解析:一次真实的类型检查修复经历】
TypeScript类型系统解析:一次真实的类型检查修复经历 在最近的管理系统开发过程中,我遇到了一个值得深入探讨的TypeScript类型问题。通过解决这个问题,我更深入地理解了TypeScript的类型系统工作原理,以及如何在Vue项目中正确处理…...

全视通无感护理巡视系统方案及产品,助力医院护士巡视病房到位
传统的护理工作中,护理巡视是一项重要且繁琐的任务。护士们需要根据不同的护理级别,定时对患者进行巡视,并手工填写巡视记录表,登记巡视时间、人员等信息。月末时,还需进行人工数据统计,这一过程不仅效率低…...

初识Redis · 命令、数据结构补充、协议
目录 前言: 数据结构补充 stream geospaital Hyperloglog bitmap bitfield 渐进式遍历命令等 认识Redis客户端及协议 前言: 在前文,我们总览一下,我们已经介绍了什么是Redis,Redis的应用场景是什么ÿ…...

DBA工作常见问题整理
MVCC机制: PostgreSQL的多版本并发控制(MVCC)是其核心特性之一,它允许数据库在高并发环境下保持高性能的同时提供事务隔离。 MVCC通过维护数据的多个版本实现: 读操作不阻塞写操作写操作不阻塞读操作避免使用锁实现并发控制 PostgreSQL的MVCC特点 写时…...
云转型(cloud transformation)——不仅仅是简单的基础设施迁移
李升伟 编译 云转型不仅仅是迁移基础设施,更是重塑企业运营、创新及价值交付的方式。它具有战略性、持续性,并影响着人员、流程和平台。 ☁️ 云转型涉及以下内容: 🔄 应用现代化——从单体架构转向微服务架构。 ⚙️ 运营自动…...

SpringBoot 定时任务
启用定时任务 首先确定需要启用定时任务的SpringBoot类,然后添加注解(EnableScheduling)以启用定时任务 package com.mt.visitorauth.anjian.service;import org.springframework.scheduling.annotation.EnableScheduling;EnableScheduli…...

常见的低代码策略整理
低代码策略通过简化开发流程、降低技术门槛、提升效率,帮助用户快速构建灵活可靠的应用。这些策略的核心优势体现在以下方面: 快速交付与降本增效 减少编码需求:通过可视化配置(如变量替换、表达式函数)替代传统编码…...
学习记录1)
HFSS(李明洋)学习记录1
Hfss操作记录 HFSS—solution type:选择求解类型Modeler—units:设置hfss内部的基本单位可选mm或者in(英寸)设置端口激励—波端口:右键selection model/face 选中对应的表面之后;右键assign excitation/po…...

泛目录站群技术架构演进观察:2025年PHP+Java混合方案实战笔记
https://www.zhanqun.xin/ 在参与某跨国电商平台SEO优化项目时,我们团队对市面上主流站群系统进行了为期半年的技术评估。最终选择部署的2025版无极多功能泛目录站群程序,其技术实现路径与工程化设计思路颇具参考价值,现整理关键发现如下。 …...

sentinel安装部署及测试--实践
一、什么是 Sentinel? Sentinel 是阿里巴巴开源的一款用于微服务流量控制和系统防护的中间件。它的主要功能包括: **流量控制(Flow Control):**限制系统的 QPS 或线程数,防止因流量过大导致系统崩溃。 **…...

Yocto项目实战教程 · 第4章:4.1小节元数据
🔍 B站相应的视频教程: 📌 Yocto项目实战教程-第4章-4.1小节-元数据 记得三连,标为原始粉丝。 在嵌入式Linux系统构建中,Yocto项目凭借其高度模块化、可配置的特性成为主流工具。而其背后的关键支撑之一,便…...

应用镜像是什么?轻量应用服务器的镜像大全
应用镜像是轻量应用服务器专属的,镜像就是轻量应用服务器的装机盘,应用镜像在原有的纯净版操作系统上集成了应用程序,例如WordPress应用镜像、宝塔面板应用镜像、WooCommerce等应用,阿里云服务器网aliyunfuwuqi.com整理什么是轻量…...

关于Java集合中对象字段的不同排序实现方式
📊 关于Java集合中对象字段的不同排序实现方式 #Java集合 #排序算法 #Comparator #性能优化 一、排序基础:两种核心方式对比 方式Comparable接口Comparator接口实现位置目标类内部实现独立类或匿名内部类排序逻辑自然排序(固定规则…...

2000-2017年各省发电量数据
2000-2017年各省发电量数据 1、时间:2000-2017年 2、来源:能源年鉴、国家统计局 3、指标:行政区划代码、城市、年份、发电量 4、范围:31省 5、指标说明:发电量是指在特定时间内,发电设备(如…...

第二十二天 - 安全加固实践 - 漏洞扫描工具开发 - 练习:SSH暴力破解防护
前言 随着网络安全威胁日益严峻,掌握基础防护技能成为开发者必备能力。本文将从零开始,通过安全加固实践、漏洞扫描工具开发、SSH暴力破解防护三个维度,带您快速构建安全防御体系。所有示例均附带完整代码,建议边阅读边实践。 一…...

【AI】React Native中使用Zustand框架及自动生成选择器
引言 随着React Native在移动应用开发领域的广泛应用,高效的状态管理变得尤为重要。Zustand作为一个轻量级的状态管理库,提供了简洁而强大的API,特别适合于React Native应用开发。本报告将详细介绍如何在React Native项目中使用Zustand框架&…...

MySQL GTID集合运算函数总结
MySQL GTID 有一些运算函数可以帮助我们在运维工作中提高运维效率。 1 GTID内置函数 MySQL 包含GTID_SUBSET、GTID_SUBTRACT、WAIT_FOR_EXECUTED_GTID_SET、WAIT_UNTIL_SQL_THREAD_AFTER_GTIDS 4个内置函数,用于GTID集合的基本运算。 1.1 GTID_SUBSET(set1,set2) …...

4.1.2 Redis协议与异步方式
文章目录 4.1.2 Redis协议与异步方式1. redis pipeline2. redis事务1. MULTI2. EXEC3. DISCARD4. WATCH 3. lua脚本1. lua基础语法2. Lua 脚本中访问 Redis 的方式3. Lua 脚本中的 KEYS 和 ARGV4、返回值5、错误处理EVALSHA 来代替 EVAL 4. ACID特性分析5. redis发布订阅1. 工作…...

ecovadis审核有什么原则?什么是ecovadis审核,有什么意义
EcoVadis审核概述 EcoVadis是一家全球知名的企业可持续发展评级机构,成立于2007年,旨在通过评估企业的环境(E)、社会(S)和治理(G)表现,帮助跨国公司管理供应链的可持续性…...

bitnet-b1.58-2B-4T和三进制
最近有个模型挺火啊现在都排进了HF排行榜的第四了 模型叫做microsoft/bitnet-b1.58-2B-4T 其实非常小的一个模型,只有2B,那这东西有多大意义呢? 它主要探索一个打法 也就是这篇论文 The era of 1-bit llms: All large language models ar…...

k8s报错kubelet.go:2461] “Error getting node“ err=“node \“k8s-master\“ not found“
问题 首先最初问题: [rootk8s-master ~]# kubectl get pods -owide --all-namespaces The connection to the server 192.168.2.129:6443 was refused - did you specify the right host or port?检查kubelet状态 查看kubelet status报找不到master节点 [rootk8…...

计算serise数据的唯一值数量
1. Series.unique() 功能:返回 Series 中所有唯一值的 数组(顺序按首次出现排列)。 返回值类型:numpy.ndarray(用户可能误认为是列表,但实际是 NumPy 数组)。 对 NaN 的处理:包含 …...

数组理论基础
什么是数组 在Java中,数组是一种数据结构,用来存储同一类型的多个元素。这些元素可以按照索引访问,方便对数据进行操作和管理。数组在编程中应用广泛,是一种基本且重要的数据结构。 数组的基本概念 1. 元素:数组中的…...

Linux操作系统--静态库和动态库的生成and四种解决加载找不到动态库的四种方法
目录 必要的知识储备: 生成静态库: 生成动态库: 解决加载找不到动态库的四种方法: 第一种:拷贝到系统默认的库路径 /usr/lib64/ 第二种:在系统默认的库路径/usr/lib64/下建立软链接 第三种࿱…...

安科瑞能源管理系统如何解决工业园区能源管理难,运维成本高的问题?
一、行业痛点:高能耗背后的“隐形炸弹 1. 能源管理粗放:水、电、气、冷热等多类型能源分散管理,人工抄表效率低,跑冒滴漏难追踪。 2. 电能质量隐患:变频设备引发谐波干扰,导致设备停机、电容器烧毁&#…...

大模型赋能工业制造革新:10个显效可落地的应用场景
在工业4.0的汹涌浪潮中,制造业正面临着前所未有的转型挑战。传统制造模式在效率、成本、质量等方面逐渐难以满足市场需求,企业急需借助新技术实现数字化转型,以提升自身竞争力。在此背景下,基于先进的数据分析技术、大模型、知识图…...

【android bluetooth 框架分析 02】【Module详解 4】【Btaa 模块介绍】
1. 背景 我们在上一篇文章中介绍 HciHal 模块时,有如下代码 // system/gd/hal/hci_hal_android_hidl.ccvoid ListDependencies(ModuleList* list) const {list->add<SnoopLogger>();if (common::init_flags::btaa_hci_is_enabled()) {list->add<ac…...

gitee新的仓库,Vscode创建新的分支详细步骤
第一步点击创建分支输入新分支的名字 第二步 第三步 第四步...