Prometheus+Grafana+K8s构建监控告警系统
一、技术介绍
Prometheus、Grafana及K8S服务发现详解
Prometheus简介
Prometheus是一个开源的监控系统和时间序列数据库,最初由SoundCloud开发,现已成为CNCF(云原生计算基金会)的毕业项目。它专注于实时监控和告警,特别适合云原生和分布式系统的监控。
Prometheus的核心功能
数据采集:通过Pull模型定期从目标服务拉取指标数据,支持HTTP端点、Pushgateway(用于短期任务)等多种采集方式
数据存储:使用高效的时间序列数据库(TSDB)存储指标数据,支持数据压缩和持久化
查询语言:提供强大的PromQL查询语言,用于分析和聚合时间序列数据
告警功能:支持基于PromQL的告警规则配置,告警信息可发送到Alertmanager进行分组、去重和路由
多维度数据模型:数据以键值对形式存储,支持多维度标签(Labels),便于灵活查询和聚合
Prometheus的架构特点
采用HTTP协议周期性抓取被监控组件的状态,任何提供HTTP接口的组件都可以接入
不依赖分布式存储,单个服务器节点可直接工作
支持服务发现或静态配置发现目标
适用于以机器为中心的监控以及高度动态面向服务架构的监控
Grafana简介
Grafana是一个开源的分析和可视化平台,允许用户从各种后端源(包括Prometheus)可视化数据。它提供了动态且交互式的仪表板,用于展示监控数据。
Grafana的核心特性
可自定义仪表板:创建视觉丰富、互动性强的仪表板
数据源灵活性:支持广泛的数据来源,包括Prometheus、Elasticsearch和InfluxDB等
警报和通知:根据可视化指标定义和触发警报
查询构建器:简化对支持的后端查询的创建过程
通用性:不仅适用于展示Prometheus数据,也适用于其他数据可视化需求
Prometheus与Grafana在K8S中的协同
在Kubernetes(K8S)环境中,Prometheus和Grafana是两个非常流行的开源工具组合:
Prometheus负责收集K8S集群和容器化应用的指标数据
Grafana负责展示这些数据,通过仪表盘直观呈现系统运行状况
这种组合为开发者和运维人员提供了强大而灵活的监控解决方案
基于K8S的服务发现作用
在Kubernetes环境中,基于服务发现的功能对Prometheus监控至关重要:
自动发现监控目标:Prometheus可以自动发现K8S集群中的Pod、Service等资源作为监控目标
动态适应环境变化:当K8S集群中的服务扩缩容或更新时,服务发现机制能自动更新监控目标列表
简化配置管理:无需手动维护监控目标列表,减少配置工作量
支持多集群监控:通过服务发现机制,Prometheus可以监控多个K8S集群
Prometheus通过定期从静态配置的监控目标或基于服务发现自动配置的目标中拉取数据,新拉取到的数据会先存储在内存缓存区,当数据量超过配置阈值时,就会持久化到存储设备中。
二、实战部署node-exporter
[root@node1 ~]# ctr -n k8s.io images import node-exporter.tar.gz
unpacking docker.io/prom/node-exporter:v0.16.0 (sha256:efc8140e40b5c940d67056cb56d720ed66965eabe03865ab1595705f4f847009)...done
[root@master ~]# kubectl create ns monitor-sa
namespace/monitor-sa created
[root@master ~]# kubectl get ns
NAME STATUS AGE
default Active 27m
kube-node-lease Active 27m
kube-public Active 27m
kube-system Active 27m
monitor-sa Active 4s
[root@master prometheus]# cat node-export.yaml
apiVersion: apps/v1
kind: DaemonSet
metadata:
name: node-exporter
namespace: monitor-sa
labels:
name: node-exporter
spec:
selector:
matchLabels:
name: node-exporter
template:
metadata:
labels:
name: node-exporter
spec:
hostPID: true
hostIPC: true
hostNetwork: true
containers:
- name: node-exporter
image: prom/node-exporter:v0.16.0
imagePullPolicy: IfNotPresent
ports:
- containerPort: 9100
resources:
requests:
cpu: 0.15
securityContext:
privileged: true
args:
- --path.procfs
- /host/proc
- --path.sysfs
- /host/sys
- --collector.filesystem.ignored-mount-points
- '"^/(sys|proc|dev|host|etc)($|/)"'
volumeMounts:
- name: dev
mountPath: /host/dev
- name: proc
mountPath: /host/proc
- name: sys
mountPath: /host/sys
- name: rootfs
mountPath: /rootfs
tolerations:
- key: "node-role.kubernetes.io/control-plane"
operator: "Exists"
effect: "NoSchedule"
volumes:
- name: proc
hostPath:
path: /proc
- name: dev
hostPath:
path: /dev
- name: sys
hostPath:
path: /sys
- name: rootfs
hostPath:
path: /
[root@master prometheus]# kubectl get pods -n monitor-sa
NAME READY STATUS RESTARTS AGE
node-exporter-gwvcf 1/1 Running 0 3m9s
node-exporter-wzck7 1/1 Running 0 4m24s
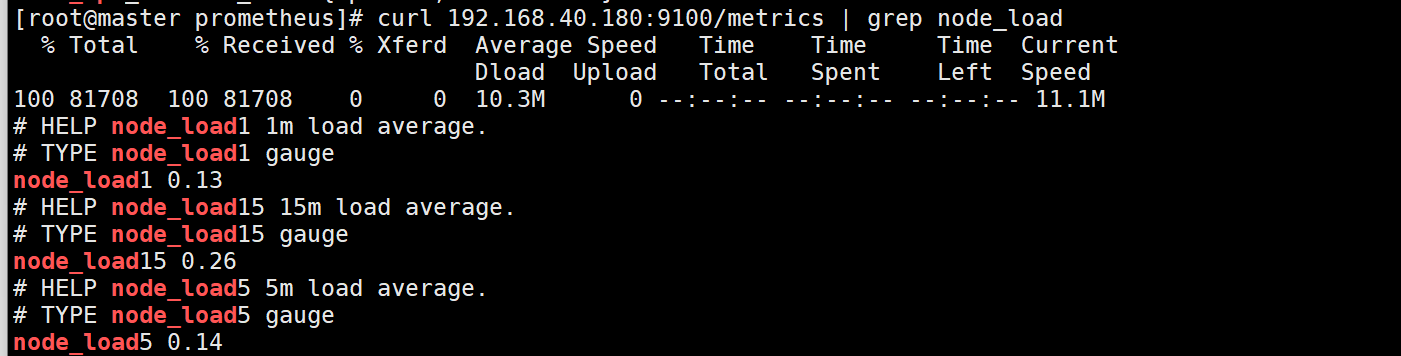
[root@master prometheus]# curl 192.168.40.180:9100/metrics | grep node_load
% Total % Received % Xferd Average Speed Time Time Time Current
Dload Upload Total Spent Left Speed
100 81708 100 81708 0 0 10.3M 0 --:--:-- --:--:-- --:--:-- 11.1M
# HELP node_load1 1m load average.
# TYPE node_load1 gauge
node_load1 0.13
# HELP node_load15 15m load average.
# TYPE node_load15 gauge
node_load15 0.26
# HELP node_load5 5m load average.
# TYPE node_load5 gauge
node_load5 0.14
Kubernetes 中部署 Node Exporter 的详细解释
操作流程概述
这段代码展示了在 Kubernetes 集群中部署 Prometheus Node Exporter 的完整过程,主要包括以下几个步骤:
导入 Node Exporter 镜像到容器运行时
创建监控专用的命名空间
部署 Node Exporter 的 DaemonSet
验证 Pod 运行状态
详细解释
1. 导入 Node Exporter 镜像
bash
Copy Code
ctr -n k8s.io images import node-exporter.tar.gz
unpacking docker.io/prom/node-exporter:v0.16.0...done
ctr 是 containerd 容器运行时的命令行工具
-n k8s.io 指定了命名空间为 k8s.io(Kubernetes 使用的命名空间)
从 node-exporter.tar.gz 文件中导入镜像
解压并加载了 prom/node-exporter:v0.16.0 镜像
2. 创建监控命名空间
bash
Copy Code
kubectl create ns monitor-sa
kubectl get ns
创建了一个名为 monitor-sa 的命名空间
列出所有命名空间确认创建成功
命名空间用于隔离监控相关的资源
3. Node Exporter DaemonSet 配置
yaml
Copy Code
apiVersion: apps/v1
kind: DaemonSet
metadata:
name: node-exporter
namespace: monitor-sa
labels:
name: node-exporter
定义了一个 DaemonSet 资源(确保每个节点运行一个 Pod 副本)
部署在 monitor-sa 命名空间
设置了 name: node-exporter 标签
yaml
Copy Code
spec:
selector:
matchLabels:
name: node-exporter
template:
metadata:
labels:
name: node-exporter
使用标签选择器匹配 Pod
Pod 模板中也设置了相同的标签
yaml
Copy Code
spec:
hostPID: true
hostIPC: true
hostNetwork: true
hostPID: true - 使用主机 PID 命名空间,可以查看主机进程
hostIPC: true - 使用主机 IPC 命名空间
hostNetwork: true - 使用主机网络栈,直接暴露主机网络信息
yaml
Copy Code
containers:
- name: node-exporter
image: prom/node-exporter:v0.16.0
imagePullPolicy: IfNotPresent
ports:
- containerPort: 9100
使用 prom/node-exporter:v0.16.0 镜像
IfNotPresent 拉取策略表示本地有镜像就不从仓库拉取
暴露 9100 端口(Node Exporter 默认端口)
yaml
Copy Code
resources:
requests:
cpu: 0.15
securityContext:
privileged: true
请求 0.15 个 CPU 核心
以特权模式运行(需要访问主机系统信息)
yaml
Copy Code
args:
- --path.procfs
- /host/proc
- --path.sysfs
- /host/sys
- --collector.filesystem.ignored-mount-points
- '"^/(sys|proc|dev|host|etc)($|/)"'
指定 procfs 和 sysfs 的挂载路径
忽略特定挂载点的文件系统统计信息
yaml
Copy Code
volumeMounts:
- name: dev
mountPath: /host/dev
- name: proc
mountPath: /host/proc
- name: sys
mountPath: /host/sys
- name: rootfs
mountPath: /rootfs
挂载主机的 /dev、/proc、/sys 和 / 到容器内
使 Node Exporter 能访问主机系统信息
yaml
Copy Code
tolerations:
- key: "node-role.kubernetes.io/control-plane"
operator: "Exists"
effect: "NoSchedule"
容忍控制平面节点的污点
确保 Node Exporter 也能在 master/control-plane 节点上运行
yaml
Copy Code
volumes:
- name: proc
hostPath:
path: /proc
- name: dev
hostPath:
path: /dev
- name: sys
hostPath:
path: /sys
- name: rootfs
hostPath:
path: /
定义主机路径卷,映射主机系统目录到容器
4. 验证 Pod 运行状态
bash
Copy Code
kubectl get pods -n monitor-sa
NAME READY STATUS RESTARTS AGE
node-exporter-gwvcf 1/1 Running 0 3m9s
node-exporter-wzck7 1/1 Running 0 4m24s
列出 monitor-sa 命名空间中的 Pod
显示两个 Node Exporter Pod 正常运行(假设集群有两个节点)
每个节点一个 Pod(DaemonSet 的特性)
总结
这段配置实现了:
在每个 Kubernetes 节点(包括控制平面节点)上部署一个 Node Exporter
Node Exporter 可以收集主机级别的监控指标(CPU、内存、磁盘、网络等)
通过 9100 端口暴露指标,供 Prometheus 抓取
使用适当的权限和挂载访问主机系统信息
这种部署方式是 Kubernetes 监控的常见模式,为集群提供了基础的主机级监控能力
三、实战部署Prometheus
[root@master prometheus]# kubectl create sa monitor -n monitor-sa
[root@master prometheus]# kubectl create clusterrolebinding monitor-binding --clusterrole=cluster-admin --serviceaccount=monitor-sa:monitor -n monitor-sa
[root@master prometheus]# kubectl create clusterrolebinding monitor-binding-2 --clusterrole=cluster-admin --user=system:serviceaccount:monitor:monitor-sa -n monitor-sa
[root@node1 ~]# mkdir -p /data
[root@node1 ~]# chmod -R 777 /data/
[root@node1 ~]# ls -ld /data/
drwxrwxrwx 2 root root 6 Mar 13 03:44 /data/
[root@master prometheus]# kubectl apply -f prometheus-cfg.yaml
configmap/prometheus-config created
[root@master prometheus]# cat prometheus-cfg.yaml
---
kind: ConfigMap
apiVersion: v1
metadata:
labels:
app: prometheus
name: prometheus-config
namespace: monitor-sa
data:
prometheus.yml: |
global:
scrape_interval: 15s
scrape_timeout: 10s
evaluation_interval: 1m
scrape_configs:
- job_name: 'kubernetes-node'
kubernetes_sd_configs:
- role: node
relabel_configs:
- source_labels: [__address__]
regex: '(.*):10250'
replacement: '${1}:9100'
target_label: __address__
action: replace
- action: labelmap
regex: __meta_kubernetes_node_label_(.+)
- job_name: 'kubernetes-node-cadvisor'
kubernetes_sd_configs:
- role: node
scheme: https
tls_config:
ca_file: /var/run/secrets/kubernetes.io/serviceaccount/ca.crt
bearer_token_file: /var/run/secrets/kubernetes.io/serviceaccount/token
relabel_configs:
- action: labelmap
regex: __meta_kubernetes_node_label_(.+)
- target_label: __address__
replacement: kubernetes.default.svc:443
- source_labels: [__meta_kubernetes_node_name]
regex: (.+)
target_label: __metrics_path__
replacement: /api/v1/nodes/${1}/proxy/metrics/cadvisor
- job_name: 'kubernetes-apiserver'
kubernetes_sd_configs:
- role: endpoints
scheme: https
tls_config:
ca_file: /var/run/secrets/kubernetes.io/serviceaccount/ca.crt
bearer_token_file: /var/run/secrets/kubernetes.io/serviceaccount/token
relabel_configs:
- source_labels: [__meta_kubernetes_namespace, __meta_kubernetes_service_name, __meta_kubernetes_endpoint_port_name]
action: keep
regex: default;kubernetes;https
- job_name: 'kubernetes-service-endpoints'
kubernetes_sd_configs:
- role: endpoints
relabel_configs:
- source_labels: [__meta_kubernetes_service_annotation_prometheus_io_scrape]
action: keep
regex: true
- source_labels: [__meta_kubernetes_service_annotation_prometheus_io_scheme]
action: replace
target_label: __scheme__
regex: (https?)
- source_labels: [__meta_kubernetes_service_annotation_prometheus_io_path]
action: replace
target_label: __metrics_path__
regex: (.+)
- source_labels: [__address__, __meta_kubernetes_service_annotation_prometheus_io_port]
action: replace
target_label: __address__
regex: ([^:]+)(?::\d+)?;(\d+)
replacement: $1:$2
- action: labelmap
regex: __meta_kubernetes_service_label_(.+)
- source_labels: [__meta_kubernetes_namespace]
action: replace
target_label: kubernetes_namespace
- source_labels: [__meta_kubernetes_service_name]
action: replace
target_label: kubernetes_name
[root@master prometheus]# cat prometheus-deploy.yaml
---
apiVersion: apps/v1
kind: Deployment
metadata:
name: prometheus-server
namespace: monitor-sa
labels:
app: prometheus
spec:
replicas: 1
selector:
matchLabels:
app: prometheus
component: server
#matchExpressions:
#- {key: app, operator: In, values: [prometheus]}
#- {key: component, operator: In, values: [server]}
template:
metadata:
labels:
app: prometheus
component: server
annotations:
prometheus.io/scrape: 'false'
spec:
nodeName: node1
serviceAccountName: monitor
containers:
- name: prometheus
image: prom/prometheus:v2.33.5
imagePullPolicy: IfNotPresent
command:
- prometheus
- --config.file=/etc/prometheus/prometheus.yml
- --storage.tsdb.path=/prometheus
- --storage.tsdb.retention=720h
- --web.enable-lifecycle
ports:
- containerPort: 9090
protocol: TCP
volumeMounts:
- mountPath: /etc/prometheus
name: prometheus-config
- mountPath: /prometheus/
name: prometheus-storage-volume
volumes:
- name: prometheus-config
configMap:
name: prometheus-config
- name: prometheus-storage-volume
hostPath:
path: /data
type: Directory
[root@master prometheus]# cat prometheus-svc.yaml
apiVersion: v1
kind: Service
metadata:
name: prometheus
namespace: monitor-sa
labels:
app: prometheus
spec:
type: NodePort
ports:
- port: 9090
targetPort: 9090
protocol: TCP
selector:
app: prometheus
component: server
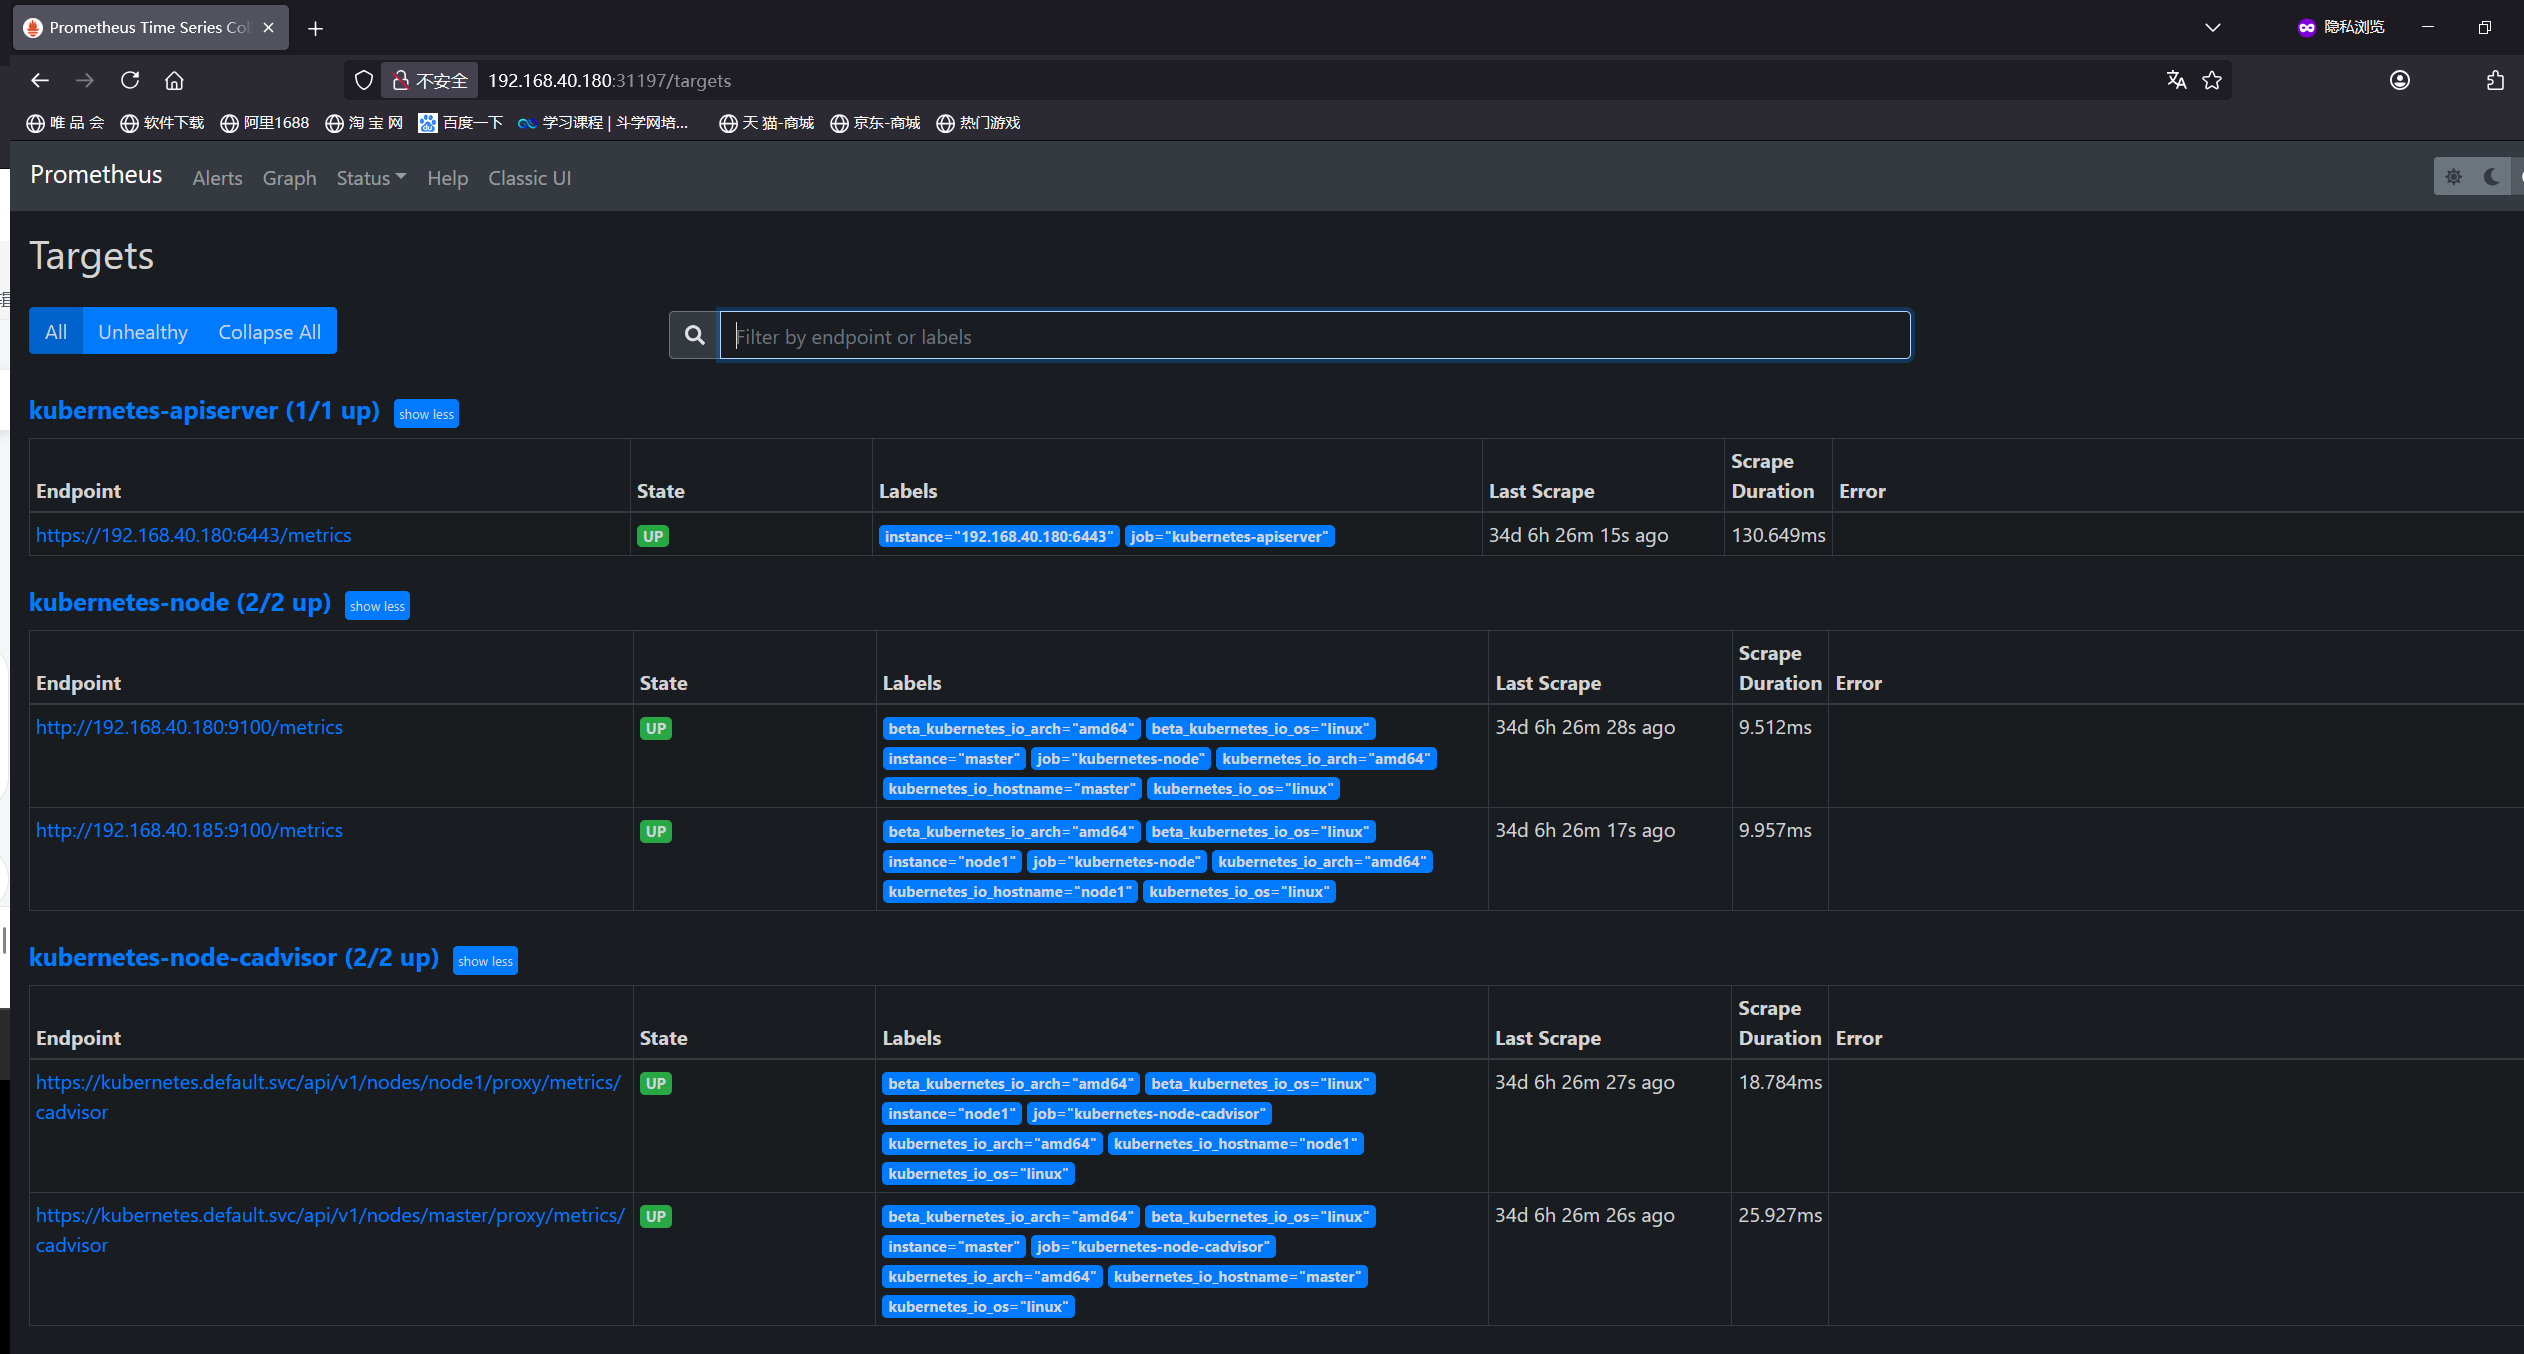
[root@master prometheus]# kubectl get svc -n monitor-sa
NAME TYPE CLUSTER-IP EXTERNAL-IP PORT(S) AGE
prometheus NodePort 10.106.100.212 <none> 9090:31197/TCP 2m28s
Kubernetes 中部署 Prometheus 监控系统的详细解释
1. 创建服务账号和权限绑定
bash
Copy Code
# 创建服务账号
kubectl create sa monitor -n monitor-sa
# 绑定集群管理员角色到服务账号
kubectl create clusterrolebinding monitor-binding --clusterrole=cluster-admin --serviceaccount=monitor-sa:monitor -n monitor-sa
# 第二个权限绑定(可能有误,serviceaccount和namespace不匹配)
kubectl create clusterrolebinding monitor-binding-2 --clusterrole=cluster-admin --user=system:serviceaccount:monitor:monitor-sa -n monitor-sa
这部分代码创建了一个服务账号(ServiceAccount)并赋予其集群管理员权限:
monitor 服务账号将被Prometheus使用来访问Kubernetes API
授予了cluster-admin角色,使Prometheus能够访问所有资源(生产环境应考虑更细粒度的权限)
2. 准备存储目录
bash
Copy Code
mkdir -p /data
chmod -R 777 /data/
在节点上创建了/data目录并设置权限,这将作为Prometheus的持久化存储位置。
3. Prometheus配置(ConfigMap)
prometheus-cfg.yaml定义了一个ConfigMap,包含Prometheus的主配置文件:
yaml
Copy Code
global:
scrape_interval: 15s # 抓取间隔
scrape_timeout: 10s # 抓取超时
evaluation_interval: 1m # 规则评估间隔
scrape_configs:
# 监控Kubernetes节点
- job_name: 'kubernetes-node'
kubernetes_sd_configs: [{role: node}]
relabel_configs:
- source_labels: [__address__]
regex: '(.*):10250'
replacement: '${1}:9100' # 将kubelet端口(10250)替换为node-exporter端口(9100)
target_label: __address__
action: replace
- action: labelmap
regex: __meta_kubernetes_node_label_(.+) # 保留节点标签
# 监控容器指标(cAdvisor)
- job_name: 'kubernetes-node-cadvisor'
kubernetes_sd_configs: [{role: node}]
scheme: https # 使用HTTPS
tls_config:
ca_file: /var/run/secrets/kubernetes.io/serviceaccount/ca.crt
bearer_token_file: /var/run/secrets/kubernetes.io/serviceaccount/token
relabel_configs: [...]
# 重写指标路径为cAdvisor端点
# 监控API Server
- job_name: 'kubernetes-apiserver'
kubernetes_sd_configs: [{role: endpoints}]
scheme: https
tls_config: {...}
relabel_configs:
- source_labels: [__meta_kubernetes_namespace, __meta_kubernetes_service_name, __meta_kubernetes_endpoint_port_name]
action: keep
regex: default;kubernetes;https # 只保留API Server的endpoint
# 监控服务端点
- job_name: 'kubernetes-service-endpoints'
kubernetes_sd_configs: [{role: endpoints}]
relabel_configs:
- source_labels: [__meta_kubernetes_service_annotation_prometheus_io_scrape]
action: keep
regex: true # 只抓取注解了prometheus.io/scrape=true的服务
# 其他重标签配置...
4. Prometheus部署(Deployment)
prometheus-deploy.yaml定义了Prometheus的部署:
yaml
Copy Code
apiVersion: apps/v1
kind: Deployment
metadata:
name: prometheus-server
namespace: monitor-sa
spec:
replicas: 1
selector:
matchLabels:
app: prometheus
component: server
template:
metadata:
labels:
app: prometheus
component: server
annotations:
prometheus.io/scrape: 'false' # 避免监控自己
spec:
nodeName: node1 # 指定部署节点
serviceAccountName: monitor # 使用之前创建的服务账号
containers:
- name: prometheus
image: prom/prometheus:v2.33.5
command:
- prometheus
- --config.file=/etc/prometheus/prometheus.yml # 配置文件路径
- --storage.tsdb.path=/prometheus # 数据存储路径
- --storage.tsdb.retention=720h # 数据保留30天
- --web.enable-lifecycle # 启用配置热加载
ports:
- containerPort: 9090 # Prometheus Web端口
volumeMounts:
- mountPath: /etc/prometheus
name: prometheus-config # 挂载配置
- mountPath: /prometheus/
name: prometheus-storage-volume # 挂载数据卷
volumes:
- name: prometheus-config
configMap:
name: prometheus-config # 使用之前创建的ConfigMap
- name: prometheus-storage-volume
hostPath:
path: /data # 使用节点上的/data目录
type: Directory
5. Prometheus服务(Service)
prometheus-svc.yaml(未完整显示)通常用于创建Service,暴露Prometheus的Web界面。
总结
这套配置实现了:
使用Kubernetes原生服务发现自动监控集群组件
监控节点指标、容器指标(cAdvisor)和API Server
通过注解(prometheus.io/scrape)选择性监控服务
使用主机路径实现数据持久化
通过ConfigMap管理配置,支持热更新
这种部署方式为Kubernetes集群提供了全面的监控能力,是云原生监控的典型实现
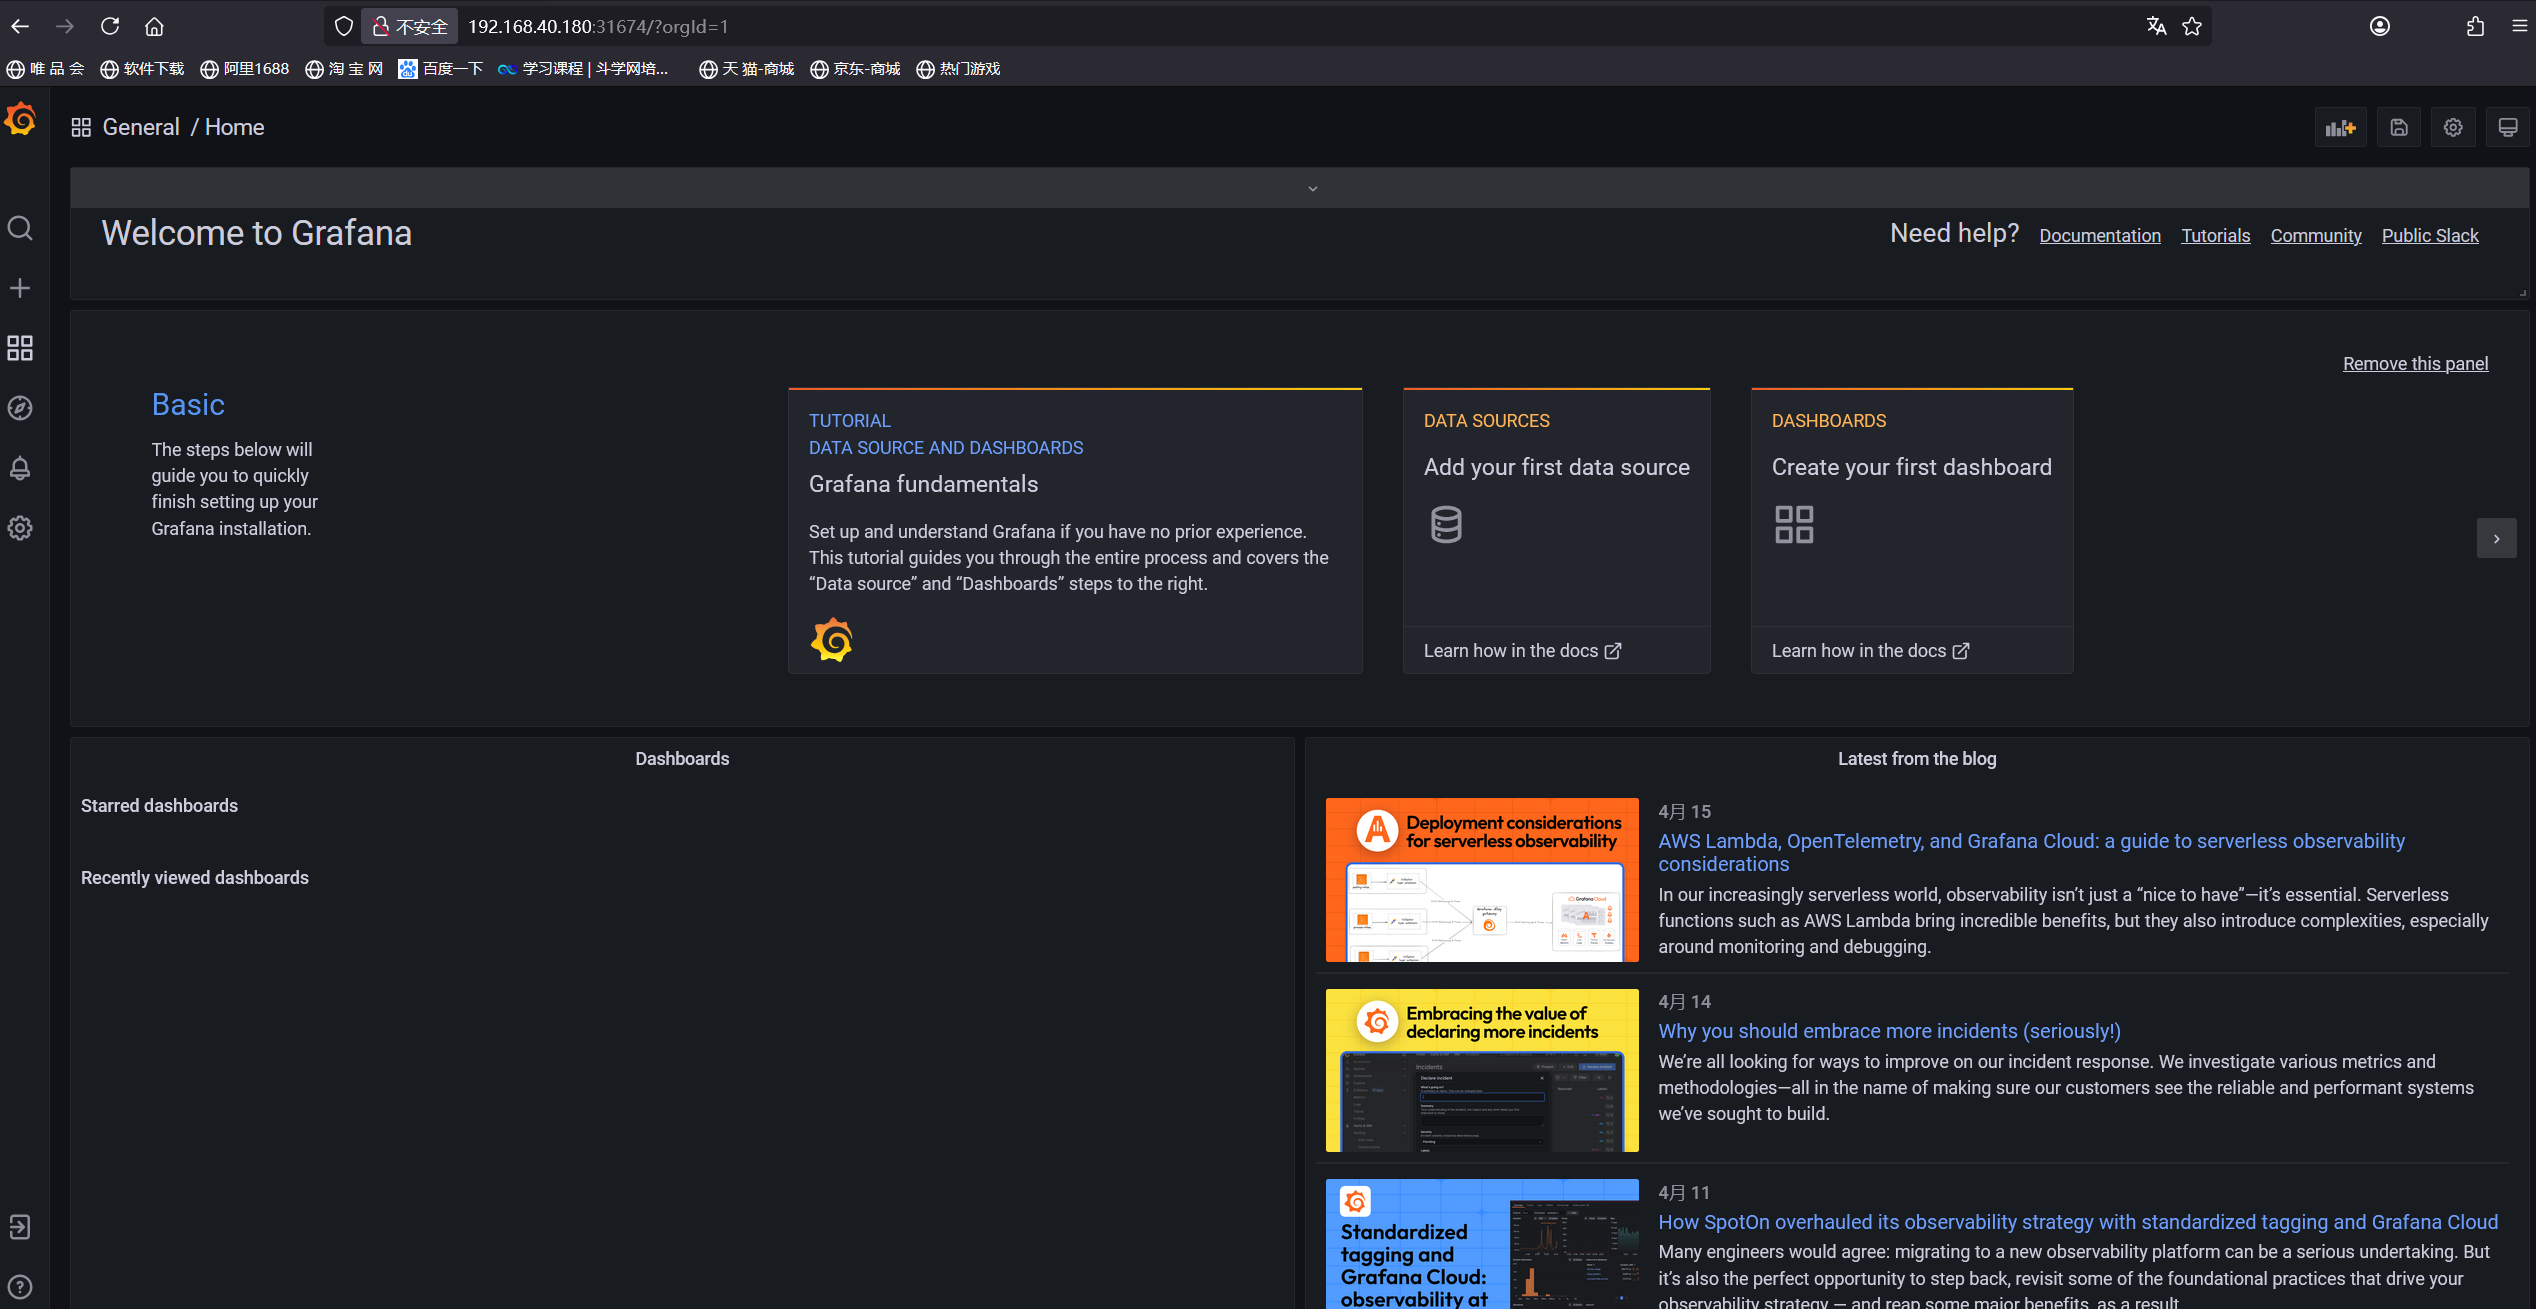
四、部署grafana
[root@master prometheus]# kubectl apply -f grafana.yaml
deployment.apps/monitoring-grafana configured
service/monitoring-grafana unchanged
[root@master prometheus]# cat grafana.yaml
apiVersion: apps/v1
kind: Deployment
metadata:
name: monitoring-grafana
namespace: kube-system
spec:
replicas: 1
selector:
matchLabels:
task: monitoring
k8s-app: grafana
template:
metadata:
labels:
task: monitoring
k8s-app: grafana
spec:
nodeName:
containers:
- name: grafana
image: grafana/grafana:8.4.5
imagePullPolicy: IfNotPresent
ports:
- containerPort: 3000
protocol: TCP
volumeMounts:
- mountPath: /etc/ssl/certs
name: ca-certificates
readOnly: true
- mountPath: /var
name: grafana-storage
- mountPath: /var/lib/grafana/
name: lib
env:
- name: INFLUXDB_HOST
value: monitoring-influxdb
- name: GF_SERVER_HTTP_PORT
value: "3000"
# The following env variables are required to make Grafana accessible via
# the kubernetes api-server proxy. On production clusters, we recommend
# removing these env variables, setup auth for grafana, and expose the grafana
# service using a LoadBalancer or a public IP.
- name: GF_AUTH_BASIC_ENABLED
value: "false"
- name: GF_AUTH_ANONYMOUS_ENABLED
value: "true"
- name: GF_AUTH_ANONYMOUS_ORG_ROLE
value: Admin
- name: GF_SERVER_ROOT_URL
# If you're only using the API Server proxy, set this value instead:
# value: /api/v1/namespaces/kube-system/services/monitoring-grafana/proxy
value: /
volumes:
- name: ca-certificates
hostPath:
path: /etc/ssl/certs
- name: grafana-storage
hostPath:
path: /var/lib/grafana-storage
type: DirectoryOrCreate
- name: lib
hostPath:
path: /var/lib/grafana/
type: DirectoryOrCreate
---
apiVersion: v1
kind: Service
metadata:
labels:
# For use as a Cluster add-on (https://github.com/kubernetes/kubernetes/tree/master/cluster/addons)
# If you are NOT using this as an addon, you should comment out this line.
kubernetes.io/cluster-service: 'true'
kubernetes.io/name: monitoring-grafana
name: monitoring-grafana
namespace: kube-system
spec:
# In a production setup, we recommend accessing Grafana through an external Loadbalancer
# or through a public IP.
# type: LoadBalancer
# You could also use NodePort to expose the service at a randomly-generated port
# type: NodePort
ports:
- port: 80
targetPort: 3000
selector:
k8s-app: grafana
type: NodePort
grafana.yaml 文件解析
这个 grafana.yaml 文件是一个 Kubernetes 资源定义文件,用于在 Kubernetes 集群中部署 Grafana 监控仪表盘。文件包含两个部分:一个 Deployment 和一个 Service。
Deployment 部分
apiVersion: apps/v1 表示使用的 Kubernetes API 版本。
kind: Deployment 表示这是一个部署资源。
metadata:
name: 部署的名称,这里是 monitoring-grafana。
namespace: 部署所在的命名空间,这里是 kube-system。
spec:
replicas: 副本数量为 1,表示只会部署一个 Grafana 实例。
selector: 用于选择哪些 Pod 属于这个部署。
template: Pod 的模板。
metadata: Pod 的元数据,包括标签。
spec: Pod 的规格。
nodeName: 指定 Pod 部署在哪个节点上,这里是 xianchaonode1。
containers:
name: 容器的名称,这里是 grafana。
image: 容器使用的镜像,这里是 grafana/grafana:8.4.5。
imagePullPolicy: 镜像拉取策略,这里是 IfNotPresent,表示如果镜像已经存在则不拉取。
ports: 容器暴露的端口,这里是 TCP 协议的 3000 端口。
volumeMounts: 挂载的卷。
env: 环境变量,用于配置 Grafana。
volumes: 定义的卷。
Service 部分
apiVersion: v1 表示使用的 Kubernetes API 版本。
kind: Service 表示这是一个服务资源。
metadata:
labels: 服务的标签。
name: 服务的名称,这里是 monitoring-grafana。
namespace: 服务所在的命名空间,这里是 kube-system。
spec:
ports: 服务暴露的端口,这里是 80 端口,目标端口是 Grafana 容器的 3000 端口。
selector: 用于选择哪些 Pod 作为服务的后端,这里是选择标签 k8s-app: grafana 的 Pod。
type: 服务的类型,这里是 NodePort,表示服务会在每个节点的随机端口上暴露,并且可以通过 <NodeIP>:<NodePort> 的方式访问。
总结
这个文件定义了一个 Grafana 部署,它部署在 xianchaonode1 节点上,使用 grafana/grafana:8.4.5 镜像,并且暴露了一个 NodePort 类型的服务,可以通过集群节点的 IP 和随机分配的端口访问 Grafana 的 Web 界面。文件中还配置了一些环境变量,用于设置 Grafana 的配置,例如 InfluxDB 的主机名、Grafana 的 HTTP 端口、认证设置等。
注意:在生产环境中,通常建议使用 LoadBalancer 或公共 IP 来暴露 Grafana 服务,并配置适当的认证和授权机制来保护 Grafana 的访问。
相关文章:

Prometheus+Grafana+K8s构建监控告警系统
一、技术介绍 Prometheus、Grafana及K8S服务发现详解 Prometheus简介 Prometheus是一个开源的监控系统和时间序列数据库,最初由SoundCloud开发,现已成为CNCF(云原生计算基金会)的毕业项目。它专注于实时监控和告警,特别适合云原生和分布式…...

用 AI + 前端实现一个简易产品图生成器:上传商品标题 → 多场景展示图自动生成
文章目录 一、项目背景与功能概述核心功能: 二、技术选型与环境准备安装依赖与 API Key 配置 三、核心功能模块实现1. 商品图生成器核心逻辑2. 组件模板与 UI 结构 四、功能拓展与优化建议(附代码思路)✅ 1. 本地历史记录可视化✅ 3. 支持图片…...

实现高效灵活的模糊搜索:JavaScript中的多条件过滤实践
现代Web应用中,数据搜索功能是用户体验的关键部分。本文将深入探讨如何实现一个高效灵活的模糊搜索函数,支持多条件组合查询、精确匹配、模糊匹配以及时间范围筛选。 需求分析 我们需要一个通用的搜索函数,能够处理以下场景: 多…...

ChatterBot的JupyterLab实践指南,从零开始构建AI聊天机器人
从手机上的语音助手到电商平台的客服机器人,这些能理解人类语言的程序背后,都离不开自然语言处理(NLP)技术的支撑。本文将以JupyterLab为实验平台,带您亲手打造一个会对话的AI机器人。通过这个项目,您不仅能…...

《深度学习》课程之卷积神经网络原理与实践教学设计方案
《深度学习》课程之卷积神经网络原理与实践教学设计方案 一、教学目标设计 (一)知识目标 学生能够准确描述卷积神经网络(CNN)的基本定义,包括其核心组成部分(如卷积层、池化层、全连接层等)及…...

快手OneRec 重构推荐系统:从检索排序到生成统一的跃迁
文章目录 1. 背景2. 方法2.1 OneRec框架2.2 Preliminary2.3 生成会话列表2.4 利用奖励模型进行迭代偏好对齐2.4.1 训练奖励模型2.4.2 迭代偏好对齐 3. 总结 昨天面试的时候聊到了OneRec,但是由于上次看这篇文章已经是一个月之前,忘得差不多了,…...

算法——直接插入排序
目录 一、直接插入排序的定义 二、直接插入排序的原理 三、直接插入排序的特点 四、代码实现 一、直接插入排序的定义 直接插入排序是一种简单直观的排序算法,其基本思想是将一个元素插入到已经排好序的部分数组中,使得插入后的数组仍然保持有序。具…...

Linux 软件管理
文章目录 dpkg软件包管理工具APT软件包管理工具apt-get命令apt-cache Linux操作系统主要支持RPM和Deb两种软件包管理工具。 RPM(Redhat Package Manager)是一种用于互联网下载包的打包及安装工具。 其原始设计理念是开放的,不仅可以在Redhat平…...

电力实训中应注意以下安全事项
电力实训中应注意以下安全事项: 一、环境准备与设备检查 保持实训场地整洁通风,清除易燃物与杂物,确保操作空间充足。 电路容量需匹配设备功率,安装漏电保护器及空气开关。 非带电金属设备外壳应接地,定期检查线路…...

序列化-流量统计
新建文件夹及文件 编写流量统计的Bean对象 package com.root.mapreduce.writable; import org.apache.hadoop.io.Writable; import java.io.DataInput; import java.io.DataOutput; import java.io.IOException; //1 继承Writable接口 public class FlowBean implements Writab…...

矩阵游戏--二分图的匈牙利算法
https://www.luogu.com.cn/problem/P1129 学习路线---https://blog.csdn.net/qq_39304630/article/details/108135381 1.二分图就是两个独立的两个集合,如这里是行和列 2.匈牙利匹配就是媒婆拉媒,没伴侣或者伴侣可以换就将当前的塞给她 3.最后true的…...

spring security解析
Spring Security 中文文档 :: Spring Security Reference 1. 密码存储 最早是明文存储,但是攻击者获得数据库的数据后就能得到用户密码。 于是将密码单向hash后存储,然后攻击者利用彩虹表(算法高级(23)-彩虹表&…...

【技巧】chol分解时,矩阵非正定时的临时补救措施,以MATLAB为例
针对非正定矩阵无法进行标准Cholesky分解的解决方案及MATLAB代码实现,结合不同应用场景的需求分层解析 文章目录 数值修正方法修正Cholesky分解LDL分解 矩阵变换与重构特征值修正乘积法构造正定矩阵 替代分解与降维方法QR分解与SVD主成分分析(PCA&#x…...
)
Hi3518E官方录像例程源码流程分析(三)
文章目录 第二阶段,初始化第一阶段计算好的参数SAMPLE_COMM_SYS_Init 第三阶段,启动VI和chn捕获SAMPLE_COMM_VI_StartVi()SAMPLE_COMM_VI_StartBT656小阶段1 SAMPLE_COMM_VI_StartMIPI_BT1120()小阶段1 SAM…...
)
37.Java 异步回调(CompletableFuture 概述、CompletableFuture 使用)
一、CompletableFuture 概述 CompletableFuture 在 Java 里面被用于异步编程,异步通常意味着非阻塞,可以使得任务单独运行在与主线程分离的其他线程中,并且通过回调可以在主线程中得到异步任务的执行状态,是否完成,和是…...
)
数学建模AI智能体(4.16大更新)
别的不说就说下面这几点,年初内卷到现在,就现阶段AI水平,卷出了我比较满意的作品,这里分享给各位同学,让你们少走弯路: 1.轻松辅导学生 2.帮助学习 3.突破知识壁垒,缩短与大佬的差距 4.打破…...

Python 第三节 流程控制
目录 1.分支结构 条件控制 2.循环语句 3.循环控制语句 4.嵌套循环 控制代码执行的顺序 顺序结构分支结构循环结构 1.分支结构 条件控制 让代码有自主选择的能力, 当满足某个条件的时候执行对应的操作 1.1 if语句 语法格式 if 判断条件:执行语句(当判断条件为真的时候执…...

深入探究Linux编译器gcc/g++:从基础到进阶
目录 一、编译的幕后流程 (一)预处理:宏与文件的魔法融合 (二)编译:代码规范性的严格审视 (三)汇编:迈向机器语言的关键一步 (四)连接&a…...

用户态网络缓冲区
用户态网络缓冲区 缓冲区作用 用于临时存储数据以便高效地进行读写操作。用户态缓冲区位于用户空间中,与内核空间中的缓冲区(内核缓冲区)相对。 用户态接受缓存区 粘包问题,缓存非完整数据包 生产者的速度 > 消费者的速…...

解决Flutter 2.10.5在升级Xcode 16后的各种报错
Flutter 环境 Flutter version 2.10.5Dart version 2.16.2DevTools version 2.9.2CocoaPods version 1.16.2Xcode 16.3 问题一:XCResult parsing error: Error: This command is deprecated and will be removed in a future release, --legacy flag is required t…...
—— 音频/视频服务)
【学习笔记】计算机网络(八)—— 音频/视频服务
第8章 互联网上的音频/视频服务 文章目录 第8章 互联网上的音频/视频服务8.1概述8.2 流式存储音频/视频8.2.1 具有元文件的万维网服务器8.2.2 媒体服务器8.2.3 实时流式协议 RTSP 8.3 交互式音频/视频8.3.1 IP 电话概述8.3.2 IP电话所需要的几种应用协议8.3.3 实时运输协议 RTP…...
——图像的直方图、图像直方图的均衡化)
OpenCv高阶(三)——图像的直方图、图像直方图的均衡化
目录 一、直方图 1、计算并显示直方图 2、使用matplotlib方法绘制直方图(不划分小的子区间) 3、使用opencv的方法绘制直方图 (划分16个小的子亮度区间) 4、绘制彩色图像的直方图,将各个通道的直方图值都画出来 二、…...
图像滤波----同时计算图像在 X 和 Y 方向上的一阶导数函数SobelXY())
OpenCV 图形API(39)图像滤波----同时计算图像在 X 和 Y 方向上的一阶导数函数SobelXY()
操作系统:ubuntu22.04 OpenCV版本:OpenCV4.9 IDE:Visual Studio Code 编程语言:C11 算法描述 cv::gapi::SobelXY 函数是 OpenCV 的 G-API 模块中用于同时计算图像在 X 和 Y 方向上的一阶导数(即 Sobel 边缘检测)的一…...

领麦微:电炖锅红外测温传感器应用,告别糊锅干烧
领麦微红外测温传感器在电炖锅中的应用,特别是在应对高温环境、实现精准测温以保留食材营养、有效防止干烧与糊锅现象,以及提供安全烹饪新保障等方面,展现出了其独特的技术优势和应用价值。以下是对这些应用特点的深入剖析: 一、高…...
自定义shell的实现)
(Linux操作系统)自定义shell的实现
讲自定义shell之前我们先看一个东西,那就是进程替换,我们想要父进程fork之后的子进程之后运行一个全新的程序那该怎么办呢? 这里就要用一个叫做进程替换的一个东西了,程序替换是通过特定的接⼝,加载磁盘上的⼀个全新的…...

安卓jks提取pem和pk8文件
你需要安装: Java Keytool OpenSSL 系统要求:Mac/Linux/Windows 都可以。 keytool -importkeystore -srckeystore holder-keystore.jks -destkeystore holder-keystore.p12 -srcstoretype JKS -deststoretype PKCS12 -srcstorepass yzhafzKPj4 -dest…...

人脸检测-人脸关键点-人脸识别-人脸打卡-haar-hog-cnn-ssd-mtcnn-lbph-eigenface-resnet
链接:https://pan.baidu.com/s/1VhGdyIW5GWuTNkfbCEc5eA?pwdz0eo 提取码:z0eo --来自百度网盘超级会员V2的分享 创建环境 conda create -n 环境名称python3.8 conda activate 环境名称 然后配置环境 pip install requirements.txt 运行程序&…...

Gobuster :dir、dns、vhost
Gobuster 及其相关技术知识必须用于法律明确允许的场景!!! 1. dir 模式:目录/文件枚举 用途:扫描目标网站的目录和文件,常用于发现隐藏资源或敏感文件。 关键参数: -u URL&am…...

Vue+Threejs项目性能优化
使用Vue和Three.js开发的项目,但运行一段时间后电脑内存就满了,导致性能下降甚至崩溃,分析内存泄漏的原因优化如下: 资源释放管理 手动释放Three.js资源: 在Vue组件的beforeDestroy或destroyed生命周期中࿰…...

Leetcode - 双周赛135
目录 一、3512. 使数组和能被 K 整除的最少操作次数二、3513. 不同 XOR 三元组的数目 I三、3514. 不同 XOR 三元组的数目 II四、3515. 带权树中的最短路径 一、3512. 使数组和能被 K 整除的最少操作次数 题目链接 本题实际上求的就是数组 nums 和的余数,代码如下&…...

[特殊字符] PostgreSQL MCP 开发指南
简介 🚀 PostgreSQL MCP 是一个基于 FastMCP 框架的 PostgreSQL 数据库交互服务。它提供了一套简单易用的工具函数,让你能够通过 API 方式与 PostgreSQL 数据库进行交互。 功能特点 ✨ 🔄 数据库连接管理与重试机制🔍 执行 SQL…...
)
等离子体浸没离子注入(PIII)
一、PIII 是什么?基本原理和工艺 想象一下,你有一块金属或者硅片(就是做芯片的那种材料),你想给它的表面“升级”,让它变得更硬、更耐磨,或者有其他特殊功能。怎么做呢?PIII 就像是用…...

TinyEngine 2.4版本正式发布:文档全面开源,实现主题自定义,体验焕新升级!
本文由体验技术团队李璇原创。 前言 TinyEngine低代码引擎使开发者能够定制低代码平台。它是低代码平台的底座,提供可视化搭建页面等基础能力,既可以通过线上搭配组合,也可以通过cli创建个人工程进行二次开发,实时定制出自己的低…...

gemini讲USRP
您好!USRP (Universal Software Radio Peripheral) 是一种软件无线电 (SDR) 设备系列,由 Ettus Research (现为 National Instruments 旗下公司) 开发和销售。USRP 提供了一个灵活且可配置的平台,用于设计、原型开发和部署各种无线通信系统。…...

智能超表面通信控制板--通道电压并行控制版
可重构智能超表面(Reconfigurable Intelligent Surface, RIS)技术是一种新兴的人工电磁表面技术,它通过可编程的方式对电磁波进行智能调控,从而在多个领域展现出巨大的应用潜力。超表面具有低成本、低能耗、可编程、易部署等特点&…...
)
Spring Task(笔记)
介绍: 应用场景: cron表达式: cron表达式在线生成器: 入门案例:...

YOLOv3的改进思路与方法:解析技术难点与创新突破
YOLOv3作为目标检测领域的经典算法,凭借其出色的速度和性能平衡获得了广泛应用。然而,随着计算机视觉技术的不断发展,YOLOv3在某些场景下的局限性也逐渐显现。本文将深入分析YOLOv3的不足之处,并系统介绍常见的改进策略和方法&…...

【解锁元生代】ComfyUI工作流与云原生后端的深度融合:下一代AIGC开发范式革命
## 从单机到云原生的认知跃迁 当2023年Stable Diffusion WebUI还在争夺本地显卡性能时,ComfyUI已悄然开启工作流模块化革命;当2024年AI绘画工具陷入"参数调优内卷",云原生技术正重塑AI开发的基础设施层。二者的深度融合࿰…...

shell 编程之正则表达式与文本处理器
目录 一、正则表达式 1. 概念 2. 作用 3. 分类 二、基础正则表达式(BRE) grep 命令选项 三、扩展正则表达式(ERE) 与 BRE 的区别 四、文本处理器 1. sed 工具 2. awk 工具 五、总结 总结对比 元字符总结 工具对比与…...

Shell编程之正则表达式与文本处理器
目录 一、引言 二、正则表达式 2.1 定义与用途 2.2 基础正则表达式 2.2.1 查找特定字符 2.2.2 利用中括号 “[]” 查找集合字符 2.2.3 查找行首 “^” 与行尾字符 “$” 2.2.4 查找任意一个字符 “.” 与重复字符 “*” 2.2.5 查找连续字符范围 “{}” 2.3 元字符总结…...

TMDOG——语言大模型进行意图分析驱动后端实践
语言大模型进行意图分析驱动后端实践 项目概述 项目地址:https://github.com/TMDOG666/AI_Backend_Demo 该项目通过语言大模型,通过分析用户意图、拆分任务、构建API调用链来驱动后端实践。 以一个简单的教务系统后端为例,将教务系统后端…...

未启用CUDA支持的PyTorch环境** 中使用GPU加速解决方案
1. 错误原因分析 根本问题:当前安装的PyTorch是CPU版本,无法调用GPU硬件加速。当运行以下代码时会报错:model YOLO("yolov8n.pt").to("cuda") # 或 .cuda()2. 解决方案步骤 步骤1:验证CUDA可用性 在Pyth…...

【mysql】Mac 通过 brew 安装 mysql 、启动以及密码设置
Mac 通过 brew 安装 mysql 、启动以及密码设置 使用 brew 安装 mysqlmysql 启动mysql密码设置参考文章: 使用 brew 安装 mysql brew install mysqlmysql 启动 下载完毕,终端告诉我们mysql数据库没有设置密码的,我们可以直接执行 mysql -u r…...

Vue2 nextTick
核心源码位置 Vue 2 的 nextTick 实现主要在 src/core/util/next-tick.js 文件中。 完整源码结构 import { noop } from shared/util import { handleError } from ./error import { isIE, isIOS, isNative } from ./envexport let isUsingMicroTask falseconst callbacks …...

Ubuntu 安装 NVIDIA显卡驱动、CUDA 以及 CuDNN工具
文章目录 一、简介二、查看显卡设备三、安装显卡驱动四、安装CUDA工具箱五、安装CuDNN小结 一、简介 NVIDIA 驱动:操作系统与 NVIDIA 显卡硬件之间的桥梁,负责驱动显卡硬件的运行,显卡的“底层操作系统”,一切的基础。CUDA&#…...
_50)
LeetCode算法题(Go语言实现)_50
题目 现有一个包含所有正整数的集合 [1, 2, 3, 4, 5, …] 。 实现 SmallestInfiniteSet 类: SmallestInfiniteSet() 初始化 SmallestInfiniteSet 对象以包含 所有 正整数。 int popSmallest() 移除 并返回该无限集中的最小整数。 void addBack(int num) 如果正整数 …...

idea报错java: 非法字符: ‘\ufeff‘解决方案
解决方案步骤以及说明 BOM是什么?1. BOM的作用2. 为什么会出现 \ufeff 错误?3. 如何解决 \ufeff 问题? 最后重新编译,即可运行!!! BOM是什么? \ufeff 是 Unicode 中的 BOM࿰…...

WPF依赖注入IHostApplicationLifetime关闭程序
WPF依赖注入IHostApplicationLifetime关闭程序 使用Application.Current.Shutdown();退出会报异常 应该使用 app.Dispatcher.InvokeShutdown(); Application.Current.Shutdown();app.Dispatcher.InvokeShutdown();static App app new();[STAThread]public static void Main(…...

如何在 IntelliJ IDEA 中安装通义灵码 - AI编程助手提升开发效率
随着人工智能技术的飞速发展,AI 编程助手已成为提升开发效率和代码质量的强大工具。在众多 AI 编程助手之中,阿里云推出的通义灵码凭借其智能代码补全、代码解释、生成单元测试等丰富功能,脱颖而出,为开发者带来了全新的编程体验。…...

【力扣】两两交换链表中的节点
两两交换链表中的节点 代码: /*** Definition for singly-linked list.* struct ListNode {* int val;* ListNode *next;* ListNode() : val(0), next(nullptr) {}* ListNode(int x) : val(x), next(nullptr) {}* ListNode(int x, ListNode *n…...