How to Label Each Point in Matplotlib Scatter Plots: A Comprehensive Guide
Matplotlib scatter label each point is a powerful technique for creating informative and visually appealing scatter plots in Python. This article will explore various methods and best practices for labeling individual points in scatter plots using Matplotlib. We’ll cover everything from basic labeling techniques to advanced customization options, providing you with the knowledge and tools to create professional-looking scatter plots with labeled points.
Understanding Matplotlib Scatter Plots and Point Labeling
Before diving into the specifics of labeling each point in a Matplotlib scatter plot, it’s essential to understand the basics of scatter plots and why point labeling is important. Matplotlib scatter plots are used to display the relationship between two variables by plotting points on a two-dimensional graph. Each point represents a pair of values, typically denoted as (x, y) coordinates.
Labeling each point in a scatter plot can provide additional context and information about the data being visualized. This is particularly useful when working with datasets where each point represents a specific entity or category, such as countries, products, or individuals.
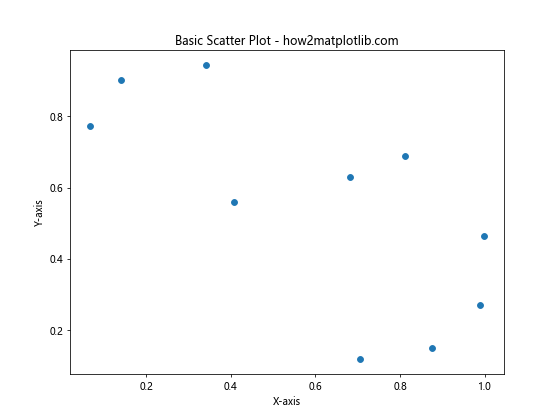
Let’s start with a simple example of creating a scatter plot without labels:
import matplotlib.pyplot as plt
import numpy as np
# Generate sample data
x = np.random.rand(10)
y = np.random.rand(10)
# Create scatter plot
plt.figure(figsize=(8, 6))
plt.scatter(x, y)
plt.title("Basic Scatter Plot - how2matplotlib.com")
plt.xlabel("X-axis")
plt.ylabel("Y-axis")
plt.show()
Output:
<span class="label">Pin It</span></a></figure>
This code creates a basic scatter plot with random data points. However, it doesn’t provide any information about individual points. Let’s explore how we can add labels to each point to make the plot more informative.
Basic Point Labeling Techniques
Using plt.annotate()
One of the simplest ways to label each point in a Matplotlib scatter plot is by using the plt.annotate() function. This function allows you to add text annotations to specific coordinates on the plot.
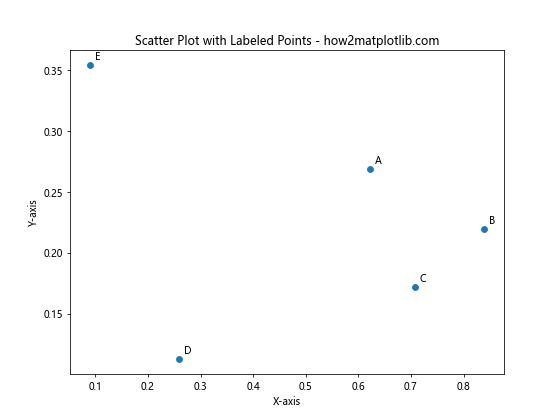
Here’s an example of how to use plt.annotate() to label each point:
import matplotlib.pyplot as plt
import numpy as np
# Generate sample data
x = np.random.rand(5)
y = np.random.rand(5)
labels = ['A', 'B', 'C', 'D', 'E']
# Create scatter plot
plt.figure(figsize=(8, 6))
plt.scatter(x, y)
# Add labels to each point
for i, label in enumerate(labels):plt.annotate(label, (x[i], y[i]), xytext=(5, 5), textcoords='offset points')
plt.title("Scatter Plot with Labeled Points - how2matplotlib.com")
plt.xlabel("X-axis")
plt.ylabel("Y-axis")
plt.show()
Output:
<span class="label">Pin It</span></a></figure>
In this example, we create a scatter plot with five points and label each point using plt.annotate(). The xytext parameter specifies the offset of the label from the point, and textcoords='offset points' indicates that the offset is in points (a unit of measure in Matplotlib).
Using plt.text()
Another method for labeling points in a scatter plot is by using the plt.text() function. This function allows you to add text at specific coordinates on the plot.
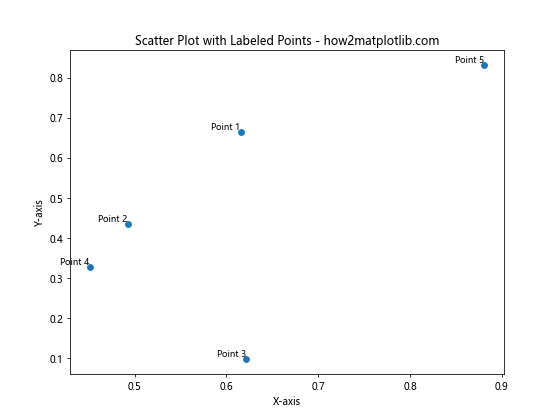
Here’s an example of how to use plt.text() to label each point:
import matplotlib.pyplot as plt
import numpy as np
# Generate sample data
x = np.random.rand(5)
y = np.random.rand(5)
labels = ['Point 1', 'Point 2', 'Point 3', 'Point 4', 'Point 5']# Create scatter plot
plt.figure(figsize=(8, 6))
plt.scatter(x, y)
# Add labels to each point
for i, label in enumerate(labels):plt.text(x[i], y[i], label, fontsize=9, ha='right', va='bottom')
plt.title("Scatter Plot with Labeled Points - how2matplotlib.com")
plt.xlabel("X-axis")
plt.ylabel("Y-axis")
plt.show()
Output:
<span class="label">Pin It</span></a></figure>
In this example, we use plt.text() to add labels to each point. The ha and va parameters control the horizontal and vertical alignment of the text relative to the point.
Advanced Point Labeling Techniques
Using Custom Markers with Text
Instead of using separate text labels, you can create custom markers that include both a symbol and text. This approach can be useful when you want to keep the labels close to the points and maintain a clean appearance.
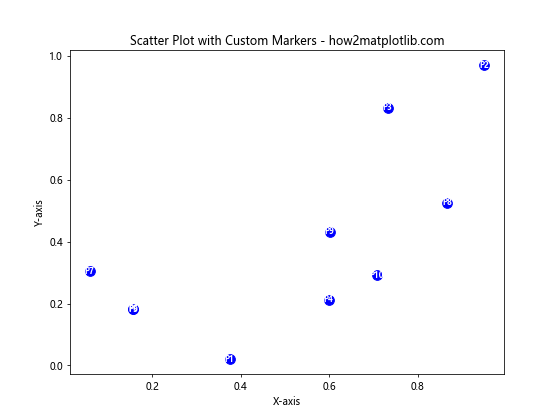
Here’s an example of how to create custom markers with text:
import matplotlib.pyplot as plt
import numpy as np
# Generate sample data
np.random.seed(42)
x = np.random.rand(10)
y = np.random.rand(10)
labels = [f'P{i+1}' for i in range(10)]
# Create scatter plot
fig, ax = plt.subplots(figsize=(8, 6))
# Create custom markers with text
for i, (xi, yi, label) in enumerate(zip(x, y, labels)):ax.plot(xi, yi, 'o', markersize=10, color='blue')ax.text(xi, yi, label, ha='center', va='center', color='white', fontweight='bold', fontsize=8)
plt.title("Scatter Plot with Custom Markers - how2matplotlib.com")
plt.xlabel("X-axis")
plt.ylabel("Y-axis")
plt.show()
Output:
<span class="label">Pin It</span></a></figure>
In this example, we create custom markers by combining a circle marker ('o') with centered text. This approach allows for a compact and visually appealing representation of labeled points.
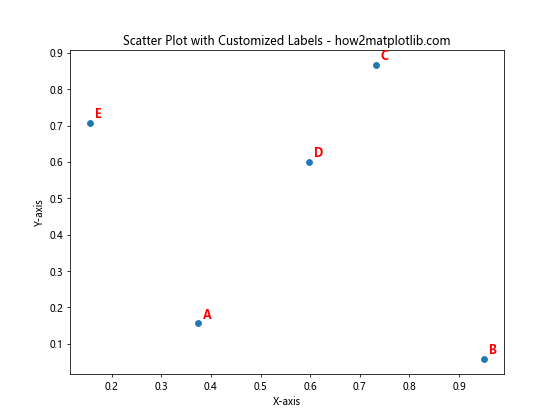
Customizing Label Appearance
Changing Font Properties
You can customize the appearance of labels by adjusting various font properties such as size, weight, style, and color. Here’s an example demonstrating different font customizations:
import matplotlib.pyplot as plt
import numpy as np
# Generate sample data
np.random.seed(42)
x = np.random.rand(5)
y = np.random.rand(5)
labels = ['A', 'B', 'C', 'D', 'E']
# Create scatter plot
plt.figure(figsize=(8, 6))
plt.scatter(x, y)# Add labels with custom font properties
for i, label in enumerate(labels):plt.annotate(label, (x[i], y[i]), xytext=(5, 5), textcoords='offset points',fontsize=12, fontweight='bold', fontstyle='italic', color='red')
plt.title("Scatter Plot with Customized Labels - how2matplotlib.com")
plt.xlabel("X-axis")
plt.ylabel("Y-axis")
plt.show()
Output:
<span class="label">Pin It</span></a></figure>
In this example, we customize the font properties of the labels using parameters such as fontsize, fontweight, fontstyle, and color.
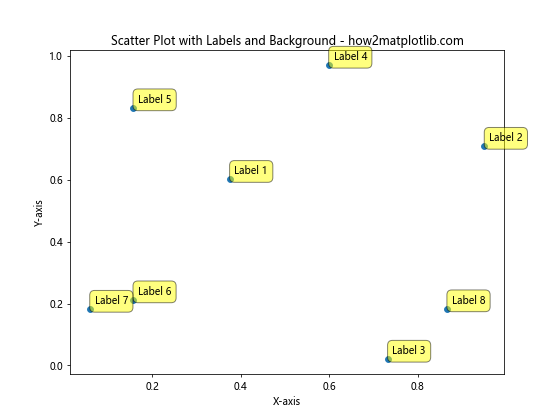
Adding Background to Labels
To improve the readability of labels, especially when they overlap with other elements in the plot, you can add a background to the labels. Here’s an example of how to add a background to labels:
import matplotlib.pyplot as plt
import numpy as np
# Generate sample data
np.random.seed(42)
x = np.random.rand(8)
y = np.random.rand(8)
labels = ['Label ' + str(i+1) for i in range(8)]
# Create scatter plot
fig, ax = plt.subplots(figsize=(8, 6))
ax.scatter(x, y)
# Add labels with background
for i, label in enumerate(labels):ax.annotate(label, (x[i], y[i]), xytext=(5, 5), textcoords='offset points',bbox=dict(boxstyle='round,pad=0.5', fc='yellow', alpha=0.5),fontsize=10)
plt.title("Scatter Plot with Labels and Background - how2matplotlib.com")
plt.xlabel("X-axis")
plt.ylabel("Y-axis")
plt.show()
Output:
<span class="label">Pin It</span></a></figure>
In this example, we use the bbox parameter in ax.annotate() to add a background to the labels. The boxstyle parameter controls the shape of the background, while fc sets the background color and alpha adjusts the transparency.
Handling Large Datasets
When working with large datasets, labeling every point can lead to cluttered and unreadable plots. In such cases, it’s often better to label only a subset of points or use interactive techniques. Let’s explore some approaches for handling large datasets.
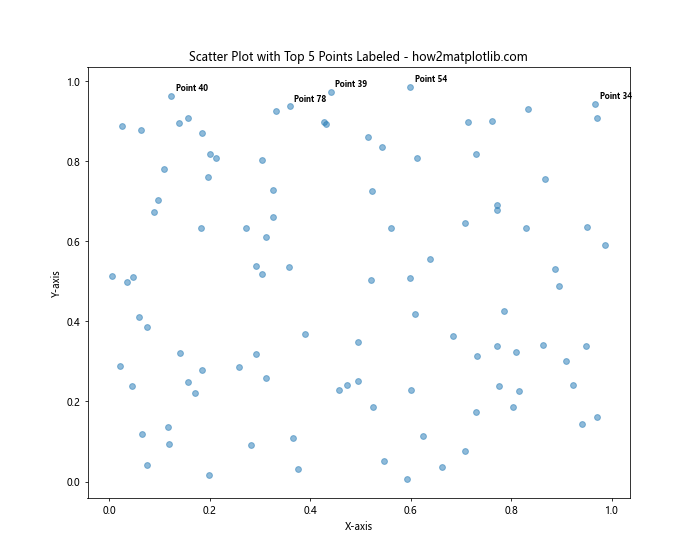
Labeling a Subset of Points
One strategy for dealing with large datasets is to label only a subset of points based on certain criteria. Here’s an example that labels only the points with the highest y-values:
import matplotlib.pyplot as plt
import numpy as np
# Generate sample data
np.random.seed(42)
x = np.random.rand(100)
y = np.random.rand(100)
# Create scatter plot
plt.figure(figsize=(10, 8))
plt.scatter(x, y, alpha=0.5)
# Label top 5 points
top_indices = y.argsort()[-5:][::-1]
for i in top_indices:plt.annotate(f'Point {i}', (x[i], y[i]), xytext=(5, 5), textcoords='offset points',fontsize=8, fontweight='bold')
plt.title(“Scatter Plot with Top 5 Points Labeled - how2matplotlib.com”) plt.xlabel(“X-axis”) plt.ylabel(“Y-axis”) plt.show()
Output:
<span class="label">Pin It</span></a></figure>
In this example, we label only the top 5 points based on their y-values. This approach helps to highlight the most significant points without cluttering the entire plot.
Combining Scatter Plots with Other Plot Types
Matplotlib scatter label each point techniques can be combined with other plot types to create more complex visualizations. Let’s explore some examples of how to integrate labeled scatter plots with other chart types.
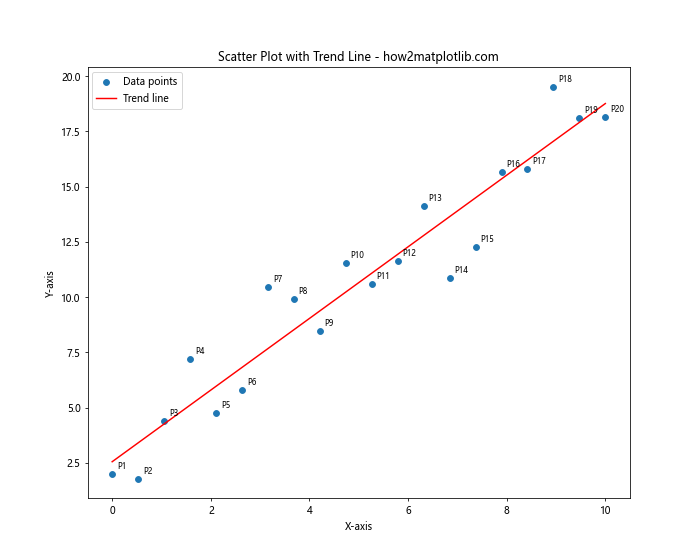
Scatter Plot with Trend Line
You can combine a scatter plot with a trend line to show both individual data points and the overall trend. Here’s an example:
import matplotlib.pyplot as plt
import numpy as np
from scipy import stats
# Generate sample data
np.random.seed(42)
x = np.linspace(0, 10, 20)
y = 2 * x + 1 + np.random.normal(0, 2, 20)
# Calculate trend line
slope, intercept, r_value, p_value, std_err = stats.linregress(x, y)
line = slope * x + intercept
# Create scatter plot with trend line
plt.figure(figsize=(10, 8))
plt.scatter(x, y, label='Data points')
plt.plot(x, line, color='red', label='Trend line')
# Label each point
for i, (xi, yi) in enumerate(zip(x, y)):plt.annotate(f'P{i+1}', (xi, yi), xytext=(5, 5), textcoords='offset points', fontsize=8)
plt.title("Scatter Plot with Trend Line - how2matplotlib.com")
plt.xlabel("X-axis")
plt.ylabel("Y-axis")
plt.legend()
plt.show()
Output:
In this example, we create a scatter plot with labeled points and add a trend line to show the overall relationship between x and y.
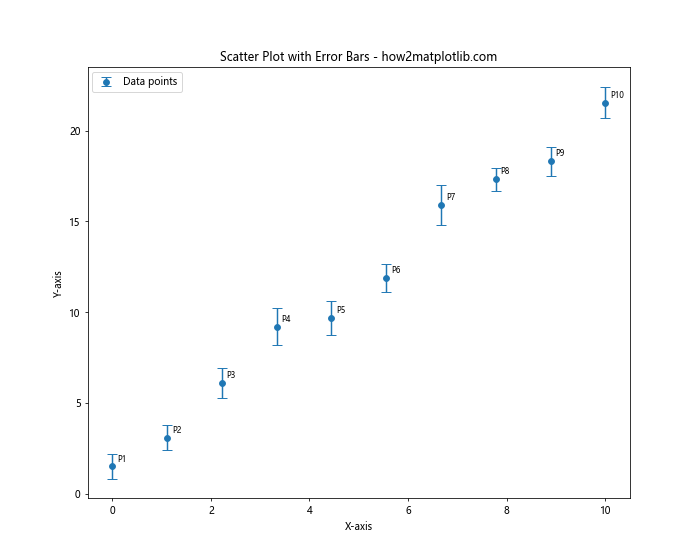
Scatter Plot with Error Bars
You can add error bars to a scatter plot to show the uncertainty or variability associated with each data point. Here’s an example:
import matplotlib.pyplot as plt
import numpy as np
# Generate sample data
np.random.seed(42)
x = np.linspace(0, 10, 10)
y = 2 * x + 1 + np.random.normal(0, 1, 10)
yerr = np.random.uniform(0.5, 1.5, 10)
# Create scatter plot with error bars
plt.figure(figsize=(10, 8))
plt.errorbar(x, y, yerr=yerr, fmt='o', capsize=5, label='Data points')
# Label each point
for i, (xi, yi) in enumerate(zip(x, y)):plt.annotate(f'P{i+1}', (xi, yi), xytext=(5, 5), textcoords='offset points', fontsize=8)
plt.title("Scatter Plot with Error Bars - how2matplotlib.com")
plt.xlabel("X-axis")
plt.ylabel("Y-axis")
plt.legend()
plt.show()
Output:
In this example, we create a scatter plot with error bars and label each point. The error bars represent the uncertainty in the y-values.
Best Practices for Matplotlib Scatter Label Each Point
When labeling points in a Matplotlib scatter plot, it’s important to follow best practices to ensure your visualizations are clear, informative, and visually appealing. Here are some tips to keep in mind:
Avoid overcrowding: If you have too many points, consider labeling only a subset or using interactive techniques.
Use consistent formatting: Keep label styles consistent throughout your plot for a professional appearance.
Choose appropriate label content: Ensure that the information in your labels is relevant and adds value to the visualization.
Consider color and contrast: Make sure your labels are easily readable against the background and don’t clash with other elements.
Adjust label positions: Use techniques like adjust_text to prevent overlapping labels and improve readability.
Provide context: Include a legend or additional annotations to explain the meaning of labels if necessary.
Balance aesthetics and information: Strive for a clean, visually appealing plot while still conveying all necessary information.
Advanced Techniques for MatplotlibScatter Label Each Point
Now that we’ve covered the basics and best practices, let’s explore some advanced techniques for labeling points in Matplotlib scatter plots.
参考 参考链接 How to Label Each Point in Matplotlib Scatter Plots: A Comprehensive Guide Matplotlib scatter label each point is a powerful technique for creating informative and visually appealing scatter plots in Python. This article will explore various …...
前沿: 此文记录了国科大所提供的一套机考试卷。
PART I VOCABULARY (20道,十分)
Directions:Choose the best word or phrase from the choices A, B, C, or D to complete the following sentences.
1.For most pe…...


)


)

】)


)


(上))


)


)


之添加导出数据功能示例9,TableView15_09带排序的导出表格示例)

:从数组到二维数组的指针魔法)


